

By: Alex Rossitch
Welcome to the 4th edition of “On the Move”. Our mission is simple, to track the data and trends around 15+ unit market rate multifamily transactions in the state of NC each month. We will be watching new deals listed, what sold, and what capital markets conditions exist so you are always up to date on the state of the market, and equipped to make the best decisions.
Late Cycle Bottoming → Early Recovery
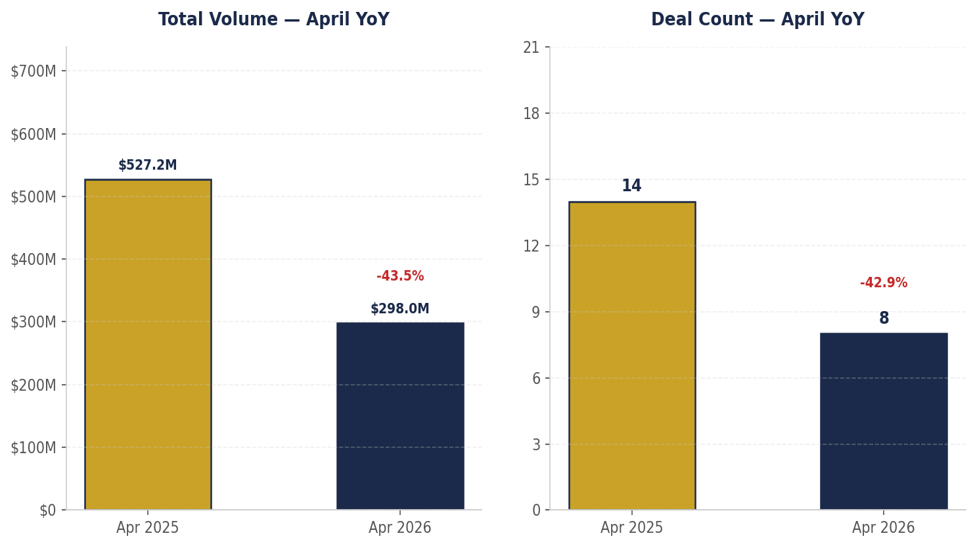
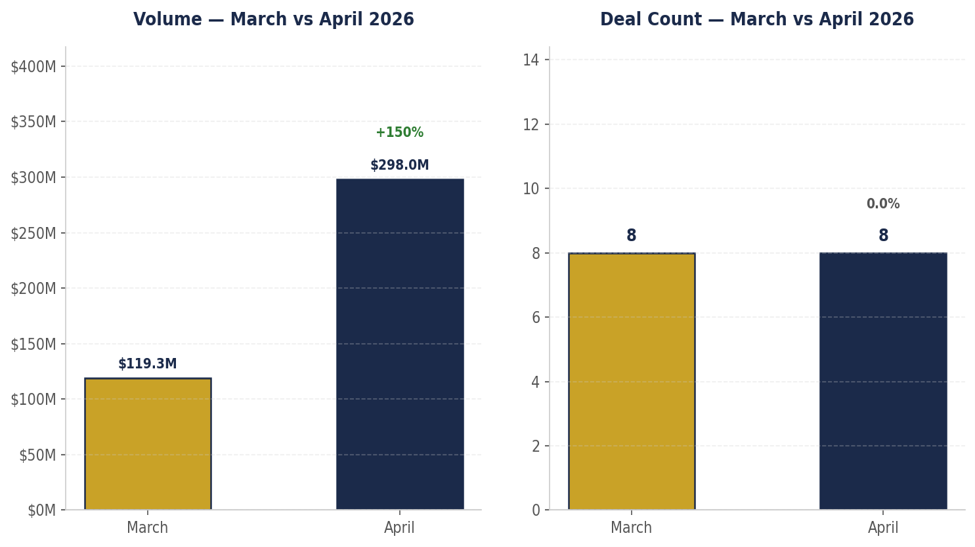
8 transactions totaling $298,011,862 in April 2026. Down 42.9% in deal count (14 in April 2025) and 43.5% in volume year over year. Month over month, deal count held flat at 8 (matching March), while volume rose 149.9% from $119.3M.
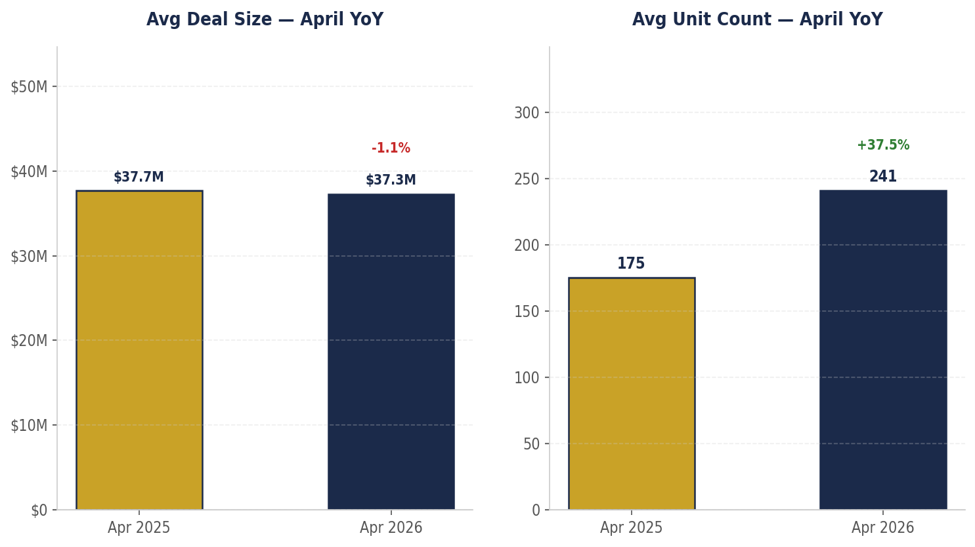
Average deal size held essentially flat in April YoY at $37.3M vs. $37.7M (-1.1%), while average unit count surged 37.5% to 241 units from 175.
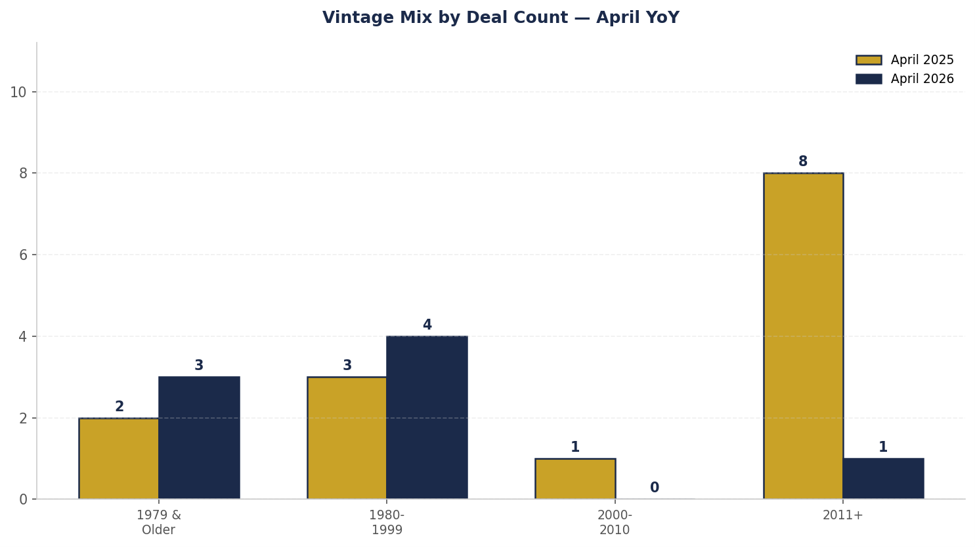
The vintage mix shifted dramatically. 1979 and older sales rose from 14.3% to 37.5%. 1980–1999 rose from 21.4% to 50.0%. 2011+ fell from 57.1% (8 of 14) to 12.5% (1 of 8). Zero deals traded in the 2000–2010 band. Average vintage moved from 2004 to 1985.
Pricing Trends — (15–99 Units): PPU of $135K sits essentially flat vs. FY 2025 baseline of $134K (+1.2%). Too small a sample to draw conclusions.
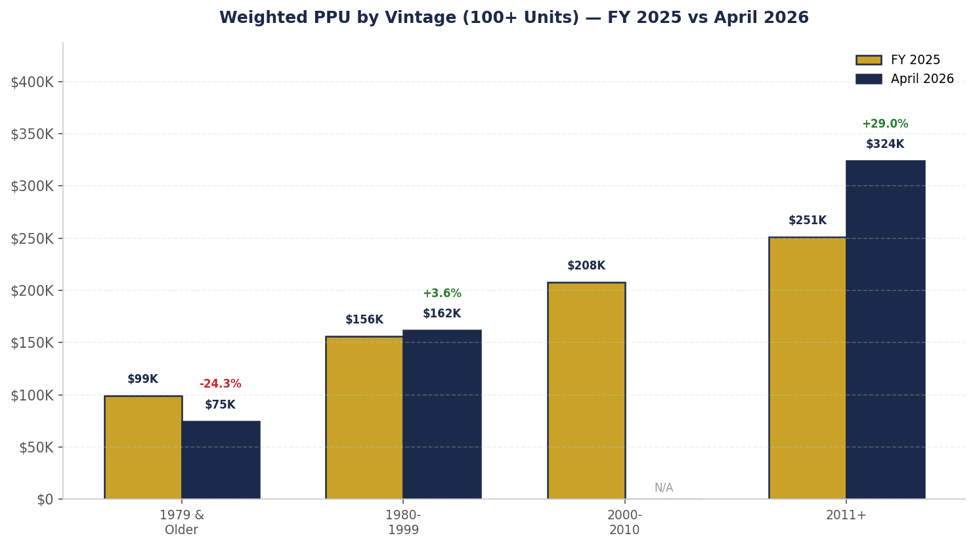
Pricing Trends — (100+ Units): PPU fell 25.0% vs. FY 2025 baseline but is more of a vintage shift than a pricing decline. 1979 and older accounted for 2 deals at $75K/unit (-24.3%), 1980–1999 had 3 deals at $162K/unit (+3.6%), and 2011+ had 1 deal at $324K/unit (+29.0%).
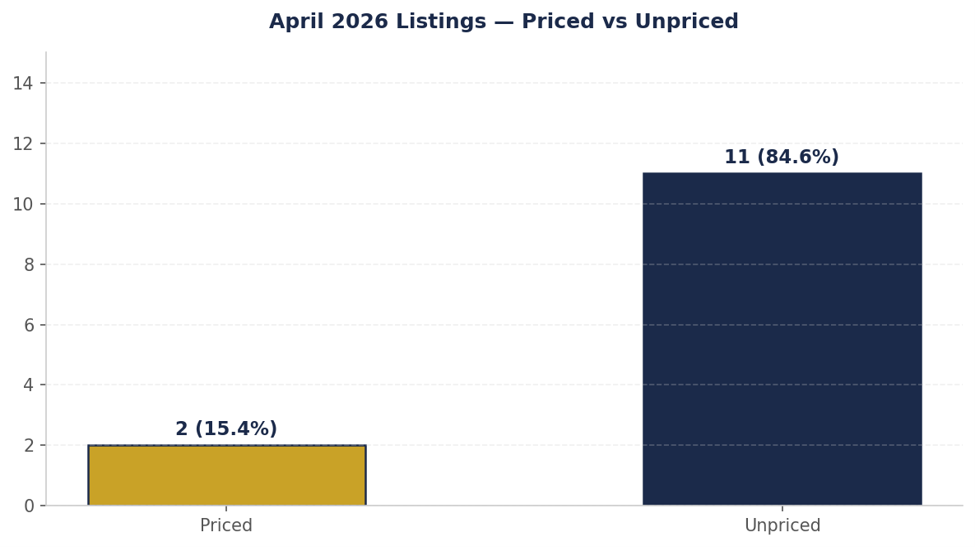
13 new listings came to market in April. 84.6% (11 of 13) were unpriced. The two priced listings were both sub-25 unit deals at $3.5M and $3.8M. 54.5% of listings were 100+ units with 15-99 at 45.5%.
1980–1999 product made up 50.0% of closings but only 23.1% of listings
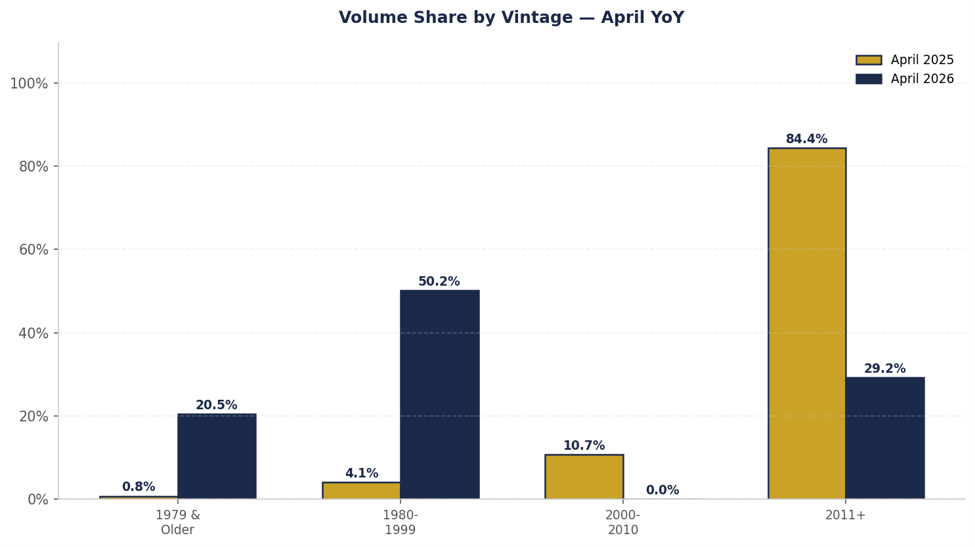
April 2025 volume was 84.4% 2011 or newer product. April 2026 was led by 1980–1999 vintage which commanded 50.2% of volume ($149.7M), 1979 and older took 20.5% ($61.2M), and 2011+ dropped to 29.2% ($87.1M).
2026 YTD volume sits at $1.09B ($480.4M in January → $191.4M in February → $119.3M in March → $298.0M in April). Annualized, that projects to roughly $3.27B, 38.4% below 2025’s $5.3B full year total.
The bond markets are not happy. As of this writing, the 10yr is sitting at 4.673%, while lower rated junk bond spreads have widened roughly 38 bps since May 1st, signaling tightening credit conditions and increasing caution around liquidity.
An interesting trend showed up today as well… oil moved lower while Treasury yields moved higher. That’s a market increasingly accepting the reality of a higher for longer rate environment.
At the same time, geopolitical risk remains elevated. If oil supply issues worsen before the Strait of Hormuz fully reopens, we could easily see another spike in energy prices that works its way back through another round of higher inflation expectations and Treasury markets.
And as seems to happen every other week, there’s apparently another deal on the table to end the conflict. Maybe it’s like the current CRE environment… deals are still getting done, they’re just taking a little longer than everyone hoped. I remain cautiously optimistic, but still planning around worst case scenarios rather than best case assumptions.
On the policy front, the naturally occurring affordable housing tax abatement program appears to be entering a major transition period. I was told today that Freddie Mac has directed originators to stop quoting tax abatement deals, which suggests meaningful changes could be coming depending on how final legislation ultimately plays out. That has the potential to materially impact deal economics across a sizable portion of the market.
Given the incentive to keep capital markets functioning amidst a record level of government debt set to roll over in the coming quarters, I believe we see a major synthetic easing move, or a combination of moves, before the end of Q3.
Whether that comes through direct liquidity measures, regulatory accommodation, or indirect balance sheet support, the system has too much debt rolling at once for policymakers to comfortably allow capital markets to seize up. The issue is that synthetic easing may stabilize rates in the near term but likely contribute to a weaker dollar over time, which creates a much more complicated environment moving forward.
If you currently have a tax abatement in place, now is the time to stress test your financials assuming that abatement disappears and there is no meaningful grandfathering protection in the final legislation.
The focus shouldn’t just be on the impact to the bottom line. You also need to understand how higher tax exposure affects DSCR and overall loan compliance stemming from it, particularly in an environment where tighter debt metrics could trigger reserve requirements, cash management provisions, or other lender protections.
On the market positioning front, today’s market is still transactable despite caution signs continuing to flash across the capital markets. Deals are getting done, but the competitive environments are generally centered around assets where expectations and pricing are aligned with today’s financing realities.
If Q1 was about positioning for recovery, April is about underwriting and planning for the scenario where it gets delayed further. If you were waiting for conditions to improve before making a move, it’s becoming increasingly clear the market may not give the kind of relief many were hoping for in the near term.
Closings & Volume
Total Deals Sold — 8 YoY Variance (April 2026 vs. April 2025) — -42.9% (14 deals in April 2025)
Total Volume — $298,011,862 YoY Variance — -43.5% ($527,181,833 in April 2025)
MoM Deal Count — 8 (Mar) → 8 (Apr) | 0.0%
MoM Volume — $119,260,800 (Mar) → $298,011,862 (Apr) | +149.9%
Month over Month Snapshot (March → April 2026)
Deal Count — 8 → 8 (0.0%)
Volume — $119.3M → $298.0M (+149.9%)
Avg Deal Size — $14.9M → $37.3M (+149.9%)
Deal Size & Unit Count
Average Deal Size — $37,251,483 YoY Variance — -1.1% ($37,655,845 in April 2025)
Average Unit Count — 241.1 units YoY Variance — +37.5% (175.4 units in April 2025)
Average Vintage — 1985 April 2025 — 2004
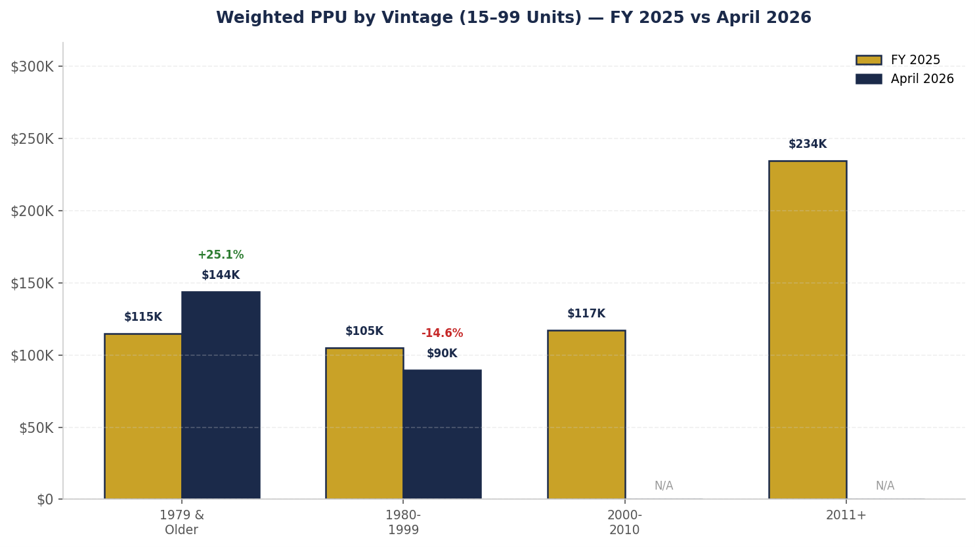
FY 2025 vs April 2026 — 15–99 Unit Deals
Overall — FY 2025 $134K/unit (95 deals, 4,275 units) → April 2026 $135K/unit (2 deals, 116 units) | +1.2%
1979 and older — $115K → $144K | +25.1% (38 vs 1 deal*)
1980–1999 — $105K → $90K | -14.6% (29 vs 1 deal*)
2000–2010 — $117K → no April 2026 deals (13 vs 0)
2011 or newer — $234K → no April 2026 deals (15 vs 0)
*Single-deal sample — interpret with caution
FY 2025 vs April 2026 — 100+ Unit Deals
Overall — FY 2025 $207K/unit (91 deals, 20,833 units) → April 2026 $156K/unit (6 deals, 1,813 units) | -25.0%
1979 and older — $99K → $75K | -24.3% (10 vs 2 deals)
1980–1999 — $156K → $162K | +3.6% (25 vs 3 deals)
2000–2010 — $208K → no April 2026 deals (12 vs 0)
2011 or newer — $251K → $324K | +29.0% (44 vs 1 deal*)
*Single-deal sample — interpret with caution
Breakdown of Deals Sold by Vintage
1979 and older — 37.5% (3 of 8) vs. 14.3% (2 of 14) in April 2025
1980–1999 — 50.0% (4 of 8) vs. 21.4% (3 of 14) in April 2025
2000–2010 — 0.0% (0 of 8) vs. 7.1% (1 of 14) in April 2025
2011 or newer — 12.5% (1 of 8) vs. 57.1% (8 of 14) in April 2025
Breakdown of Deals Sold by Unit Count
Sub-100 units — 25.0% (2 of 8) vs. 42.9% (6 of 14) in April 2025
100+ units — 75.0% (6 of 8) vs. 57.1% (8 of 14) in April 2025
Transaction Volume by Vintage Band
1979 and older — $61.2M (20.5% of vol) vs. $4.1M (0.8%) in April 2025
1980–1999 — $149.7M (50.2% of vol) vs. $21.6M (4.1%) in April 2025
2000–2010 — $0 (0.0% of vol) vs. $56.6M (10.7%) in April 2025
2011 or newer — $87.1M (29.2% of vol) vs. $444.8M (84.4%) in April 2025
Average Deal Size by Vintage
1979 and older — $20.4M vs. $2.1M in April 2025
1980–1999 — $37.4M vs. $7.2M in April 2025
2000–2010 — No April 2026 deals vs. $56.6M in April 2025
2011 or newer — $87.1M vs. $55.6M in April 2025
Average Unit Count by Vintage
1979 and older — 242 units vs. 23 in April 2025
1980–1999 — 233 units vs. 54 in April 2025
2011 or newer — 269 units vs. 246 in April 2025
Listing
New Listings — 13 total (2 priced, 11 unpriced)
Priced Listings — $3.8M (21 units) and $3.5M (24 units)
84.6% of April listings came to market unpriced
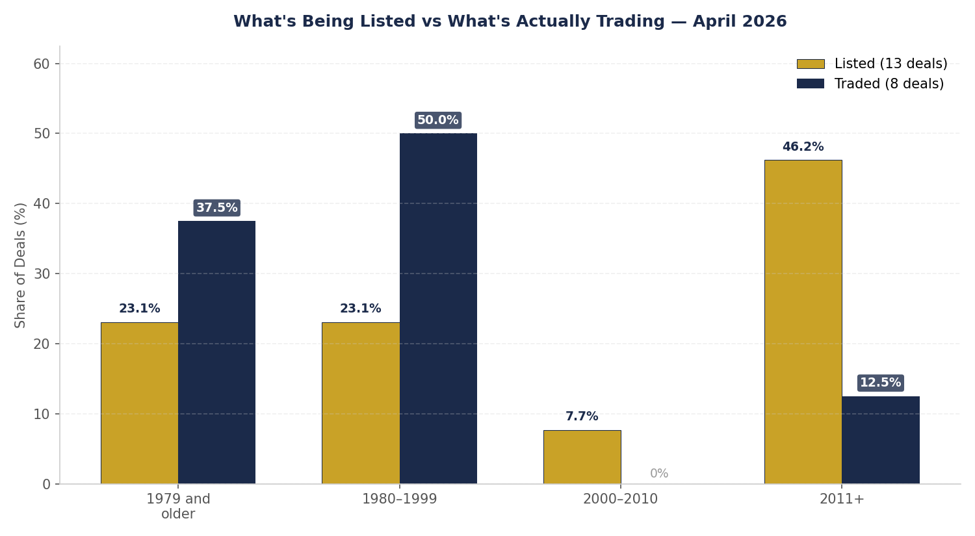
What’s Being Listed vs What’s Actually Trading
Listings by Vintage:
1979 and older — 3 of 13 listings (23.1%) vs. 37.5% of closings
1980–1999 — 3 of 13 listings (23.1%) vs. 50.0% of closings
2000–2010 — 1 of 13 listings (7.7%) vs. 0.0% of closings
2011 or newer — 6 of 13 listings (46.2%) vs. 12.5% of closings
Partner with us to navigate the complexities of commercial real estate. Get in touch today to explore how our expertise can unlock the full potential of your real estate investments.