

By: Alex Rossitch
Welcome to the 5th edition of “On the Move”. Our mission is simple, to track the data and trends around 15+ unit market rate multifamily transactions in the state of NC each month. We will be watching new deals listed, what sold, and what capital markets conditions exist so you are always up to date on the state of the market, and equipped to make the best decisions.
Late Cycle → Early Recovery
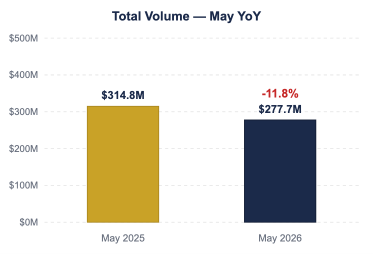
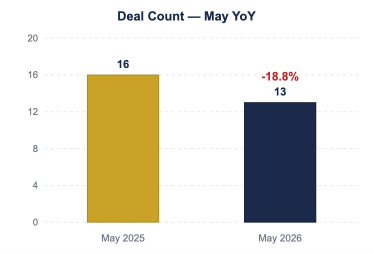
13 transactions totaling $277,698,000 closed across North Carolina in May 2026. That is down 18.8% in deal count and 11.8% in volume compared to May 2025.
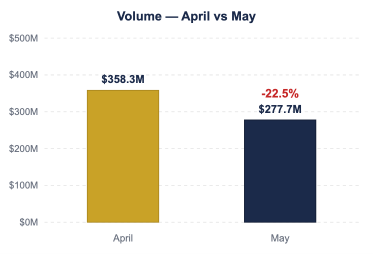
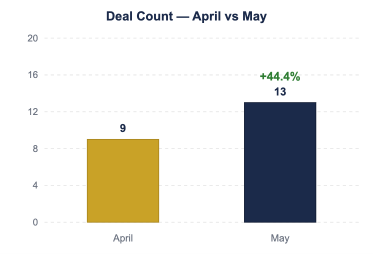
Month over month, volume moved down 22.5% from $358,291,858 in April to $277,698,000 in May, while deal count increased from 9 to 13.
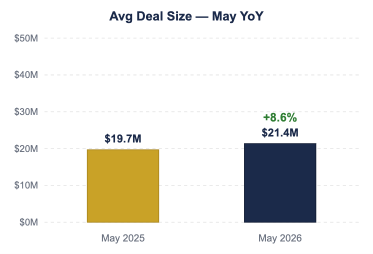
Average deal size landed at $21,361,385, up 8.6% year over year.
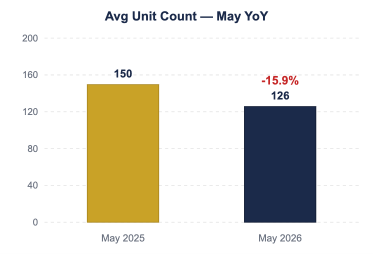
Average unit count on the deals tracked in detail was 126 units, down 15.9% year over year compared to 150 units in May 2025.
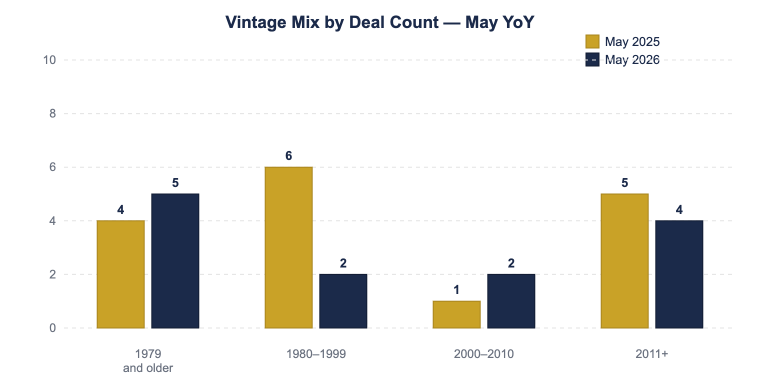
The average vintage of what traded was 1993, just one year older than the 1994 average vintage that traded a year ago.
By count, 1979 and older product commanded 38.5% of activity, accounting for 5 of the 13 tracked deals.
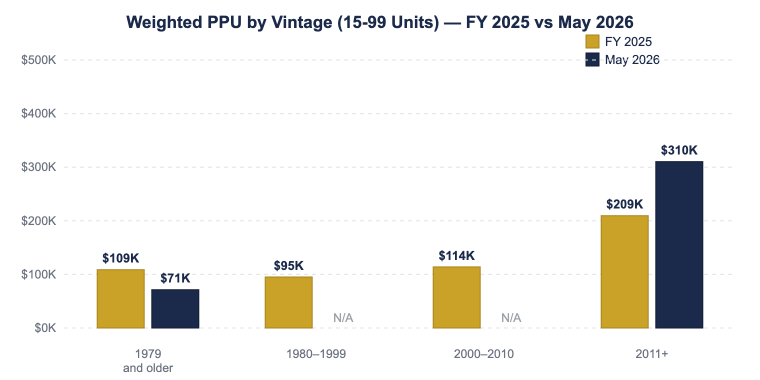
Pricing Trends — 15–99 Units: Weighted price per unit was $159,075 across 8 deals, down 6.3% versus a year ago.
By vintage in the 15–99 unit cohort, 1979 and older product traded at $71,383/unit across 5 deals, down 34.3% year over year. 2011+ product traded at $310,463/unit across 3 deals, down 10.1% year over year.
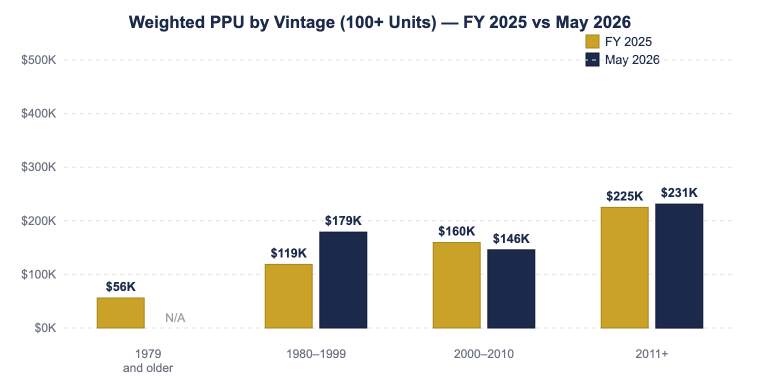
Pricing Trends — 100+ Units: Weighted price per unit was $175,437 across 5 deals, up 39.7% versus a year ago.
By vintage in the 100+ unit cohort, 1980–1999 product traded at $179,000/unit across 2 deals, up 29.8% year over year. 2000–2010 product traded at $145,917/unit across 2 deals, down 6.6% year over year. 2011+ product traded at $231,250/unit across 1 deal.
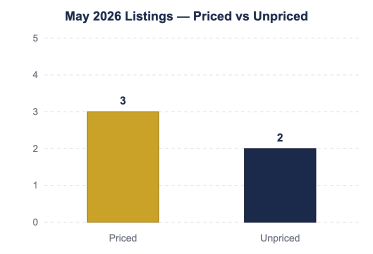
On the listing side, 5 new deals came to market in May. 3 were priced and 2 were unpriced, meaning 40% of new listings arrived without pricing guidance.
Through May, North Carolina has closed $1,463,219,658 in 2026 YTD transaction volume. Annualized, that projects to roughly $3,511,727,179 for the year, which would put the state approximately 38.6% below 2025’s full-year total of $5,720,489,674.
Looked like we might finally have a deal that will stick… now who knows, but time will tell. The oil markets seem to buy it and are responding positively, but we are still about 52 days out from knowing whether this one holds or not, and it still cost more than $100 to fill up my car this morning.
Treasuries seemed to respond to the deal positively as well, but one bad headline can see that flip quickly. The thesis many had, and still have, that a rate cut was going to be realized in 2026 is looking highly unlikely. In fact, the markets are assigning meaningful odds of a hike by the end of the year.
Inflation is still running hot. Credit spreads have quietly widened over the last week since the deal was announced, the spread between the 10-year and the 2-year is compressed, and the Fed is leaning hawkish. It is going to be an interesting end to the year.
On the fundamental side, sentiment reads positive, or maybe just hopeful, but I am seeing mixed signals that concern me. Rents and occupancy should be accelerating going into the busy leasing season, but they are lagging behind and data would suggest decelerating slightly in some areas. More on that in the Q2 Market Report.
As it stands right now, 50.2% of available units for rent in our dataset carry concessions, with an average concession of 2.03 months. The gap between the best and worst submarkets in this state is wide, and operators in the wrong submarkets are feeling it.
I have heard many times over the last six months that institutional capital is waiting for one more strong leasing season before the capital flow turns back on. It looks like they will be waiting a little longer.
I expect 2026 statewide listing and sales volume to ramp up heading into the back half of the year. I think we land somewhere in the $4.5B to $4.75B range, which would still be a meaningful drop from 2025.
The activity is more likely to come from pressured sellers walking the debt maturity wall, or sellers that have accepted the reality of the current environment, than from a fundamentals improvement perspective that draws discretionary capital off the sidelines.
The time for watching and waiting for rates to come down meaningfully is over, especially if you are on a clock. Now is the time to evaluate your situation, weigh all available options, and make a decision.
Fundamentals and clean operational stories matter more than ever. If your property is experiencing higher vacancy than expected, I would spend time really studying your market and competition so you can position accordingly.
The owners, operators, and buyers who are nimble in their business plans and expectations will make out better as we transition into this next cycle than those that are not.
Closings & Volume
| Metric | May 2026 | May 2025 | YoY Variance |
|---|---|---|---|
| Total Deals Sold | 13 | 16 | -18.8% |
| Total Volume | $277,698,000 | $314,784,500 | -11.8% |
| Average Deal Size | $21,361,385 | $19,674,031 | +8.6% |
Month Over Month Snapshot — April to May 2026
| Metric | April | May | MoM |
|---|---|---|---|
| Deal Count | 9 | 13 | +44.4% |
| Volume | $358,291,858 | $277,698,000 | -22.5% |
| Avg Deal Size | $39,810,206 | $21,361,385 | -46.3% |
Deal Size & Unit Count
| Metric | May 2026 | May 2025 | Variance |
|---|---|---|---|
| Average Unit Count | 125.7 | 149.5 | -15.9% |
| Average Vintage | 1993 | 1994 | — |
FY 2025 vs. May 2026 — 15–99 Unit Deals
| Vintage | FY 2025 | May 2026 | Variance |
|---|---|---|---|
| Overall | $125K (105 deals) |
$159K (8 deals) |
+26.8% |
| 1979 and older | $109K (42) |
$71K (5) |
-34.3% |
| 1980–1999 | $95K (31) |
— | — |
| 2000–2010 | $114K (14) |
— | — |
| 2011+ | $209K (18) |
$310K (3) |
+48.2% |
FY 2025 vs. May 2026 — 100+ Unit Deals
| Vintage | FY 2025 | May 2026 | Variance |
|---|---|---|---|
| Overall | $170K (122 deals) |
$175K (5 deals) |
+3.1% |
| 1979 and older | $56K (15) |
— | — |
| 1980–1999 | $119K (32) |
$179K (2) |
+50.8% |
| 2000–2010 | $160K (18) |
$146K (2) |
-8.5% |
| 2011+ | $225K (57) |
$231K (1) |
+2.8% |
Breakdown of Deals Sold by Vintage
| Vintage | May 2026 | May 2025 |
|---|---|---|
| 1979 and older | 38.5% (5 of 13) |
25.0% (4 of 16) |
| 1980–1999 | 15.4% (2 of 13) |
37.5% (6 of 16) |
| 2000–2010 | 15.4% (2 of 13) |
6.2% (1 of 16) |
| 2011+ | 30.8% (4 of 13) |
31.2% (5 of 16) |
Breakdown of Deals Sold by Unit Count
| Size | May 2026 | May 2025 |
|---|---|---|
| Sub-100 units | 61.5% (8 of 13) |
43.8% (7 of 16) |
| 100+ units | 38.5% (5 of 13) |
56.2% (9 of 16) |
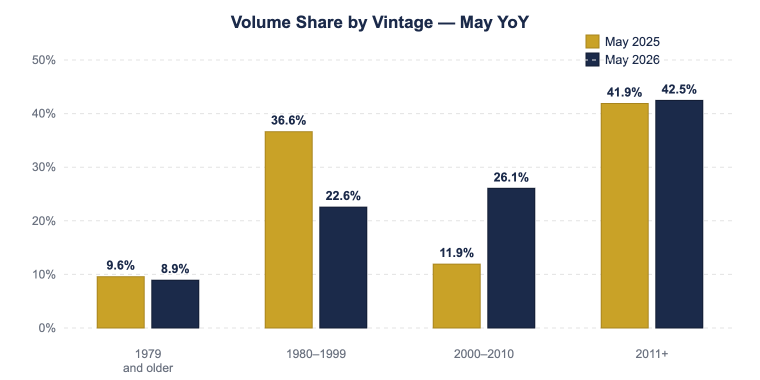
Transaction Volume by Vintage Band
| Vintage | May 2026 | May 2025 |
|---|---|---|
| 1979 and older | $24,770,000 (8.9%) |
$30,125,392 (9.6%) |
| 1980–1999 | $62,650,000 (22.6%) |
$115,309,108 (36.6%) |
| 2000–2010 | $72,375,000 (26.1%) |
$37,500,000 (11.9%) |
| 2011+ | $117,903,000 (42.5%) |
$131,850,000 (41.9%) |
Average Deal Size by Vintage
| Vintage | May 2026 | May 2025 |
|---|---|---|
| 1979 and older | $4,954,000 | $7,531,348 |
| 1980–1999 | $31,325,000 | $19,218,185 |
| 2000–2010 | $36,187,500 | $37,500,000 |
| 2011+ | $29,475,750 | $26,370,000 |
Average Unit Count by Vintage
| Vintage | May 2026 | May 2025 |
|---|---|---|
| 1979 and older | 69 units | 91 units |
| 1980–1999 | 175 units | 145 units |
| 2000–2010 | 248 units | 240 units |
| 2011+ | 110 units | 183 units |
Listings
New Listings — 5 total (3 priced, 2 unpriced)
| Units | Yr Built | Ask | Listed | Status |
|---|---|---|---|---|
| 346 | 1999 | Unpriced | 2026-05-07 | New to Market |
| 29 | 1989 | $4,100,000 | 2026-05-18 | On-Market |
| 28 | 1973 | $4,250,000 | 2026-05-20 | On-Market |
| 15 | 1969 | $1,850,000 | 2026-05-08 | On-Market |
| ? | ? | Unpriced | 2026-05-28 | New to Market |
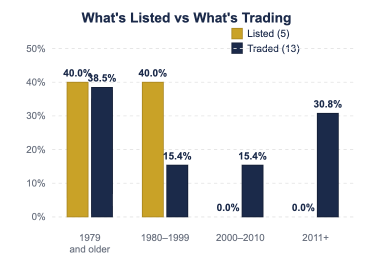
What’s Being Listed vs. What’s Actually Trading
| Vintage | Listed | Traded |
|---|---|---|
| 1979 and older | 2 of 5 (40.0%) |
38.5% of closings |
| 1980–1999 | 2 of 5 (40.0%) |
15.4% of closings |
| 2000–2010 | 0 of 5 (0.0%) |
15.4% of closings |
| 2011+ | 0 of 5 (0.0%) |
30.8% of closings |
2026 YTD Volume
| Month | Volume |
|---|---|
| January | $486,945,000 |
| February | $197,624,000 |
| March | $142,660,800 |
| April | $358,291,858 |
| May | $277,698,000 |
| YTD | $1,463,219,658 |
| Annualized | $3,511,727,179 |
Partner with us to navigate the complexities of commercial real estate. Get in touch today to explore how our expertise can unlock the full potential of your real estate investments.