


By: Alex Rossitch
Welcome to the 8th edition of the NC Multifamily Market Report. Our mission is simple, to track the data and trends around 15+ unit market rate multifamily transactions in the state of NC each month. We will be watching new deals listed, what sold, and what capital markets conditions exist so you are always up to date on the state of the market, and equipped to make the best decisions.
Late Cycle —> Stabilizing
Despite macro pressure, transaction volume indicates the market is stabilizing as higher rates force movement
*All August closing data is current as of September 15, 2026, and it subject to revision. Market conditions are subject to change. For the latest information on the North Carolina multifamily market, please contact Alex Rossitch at Aline Capital.
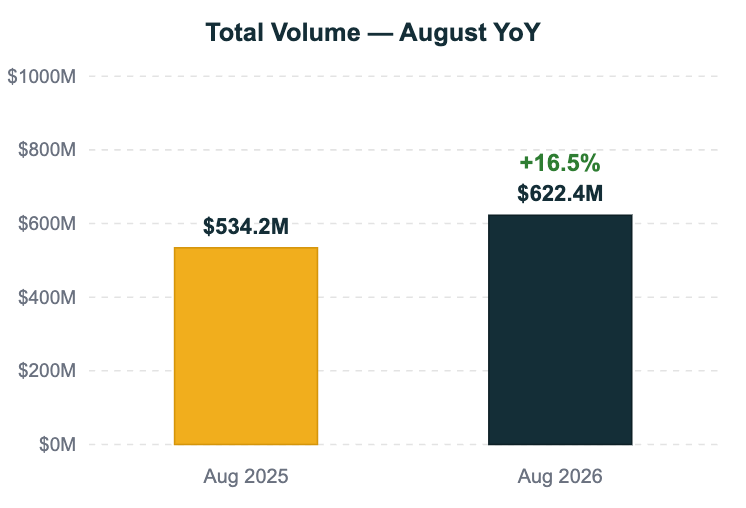
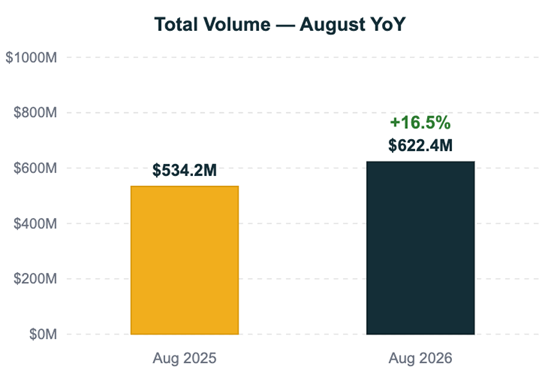
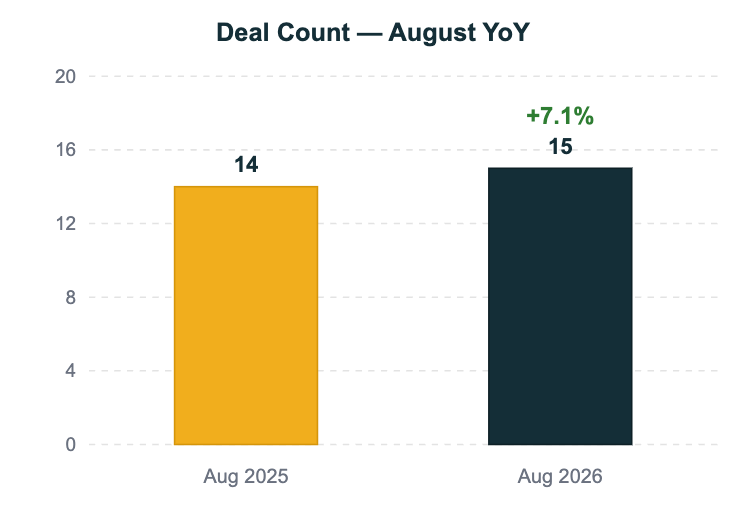
In the NC multifamily market, 15 transactions totaling $622,392,000 closed across NC in August 2026. That is +7.1% in deal count and +16.5% in volume against August 2025.
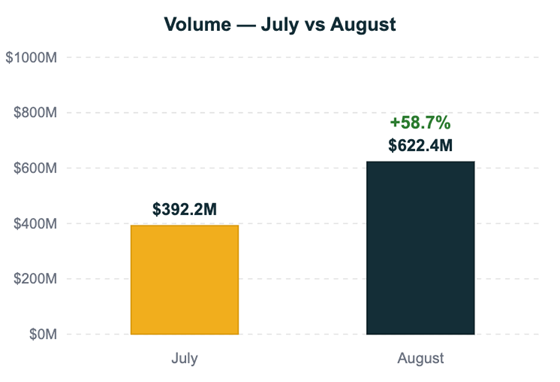
Against the prior month, volume moved +58.7% from $392,243,000 in July to $622,392,000.
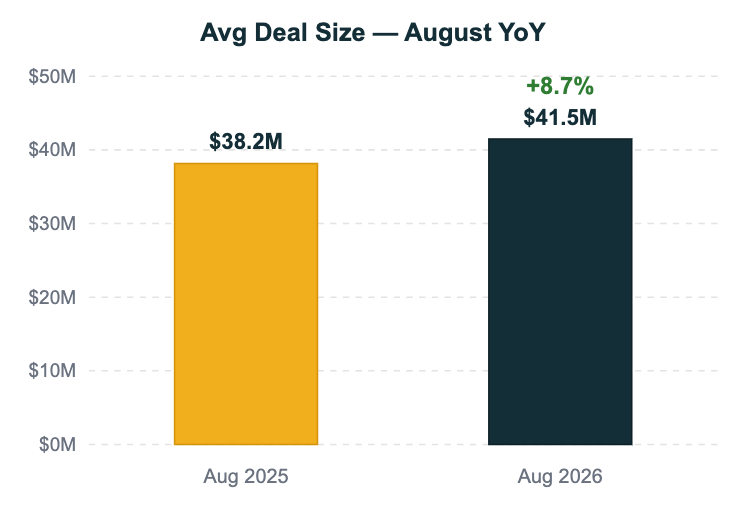
Average deal size landed at $41,492,800, +8.7% year over year.
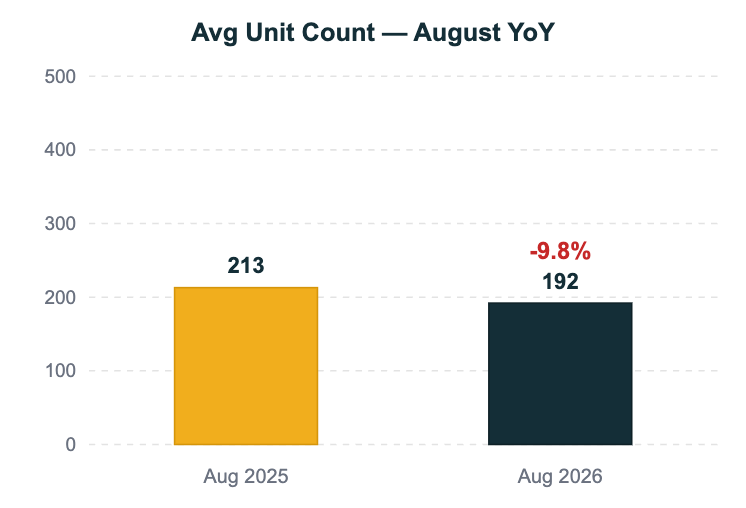
Average unit count on the deals I track in detail was 192 units, -9.8% year over year (versus 213 a year ago).
The average vintage of what traded was 2004, 3 years older than the 2007 that traded a year ago.
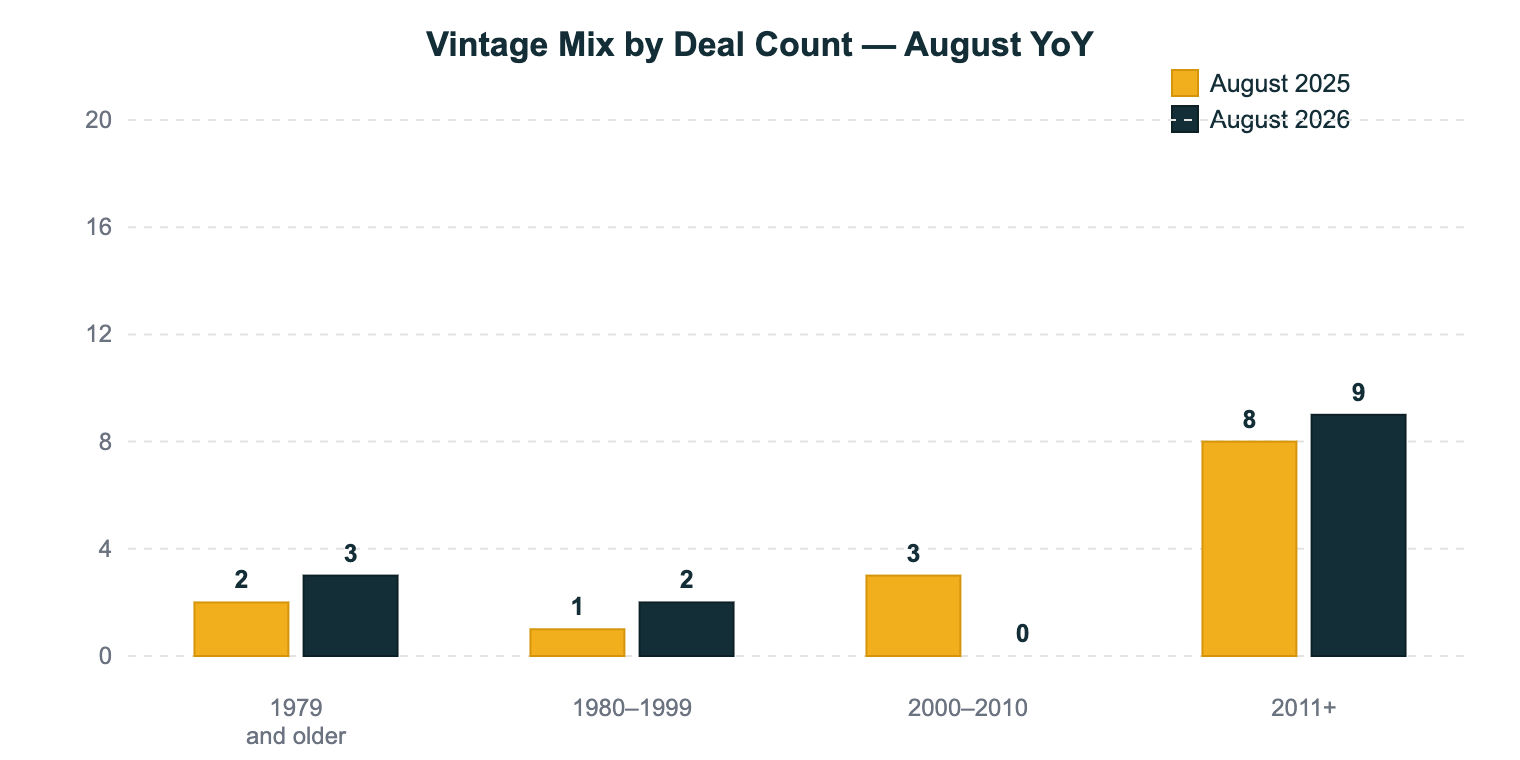
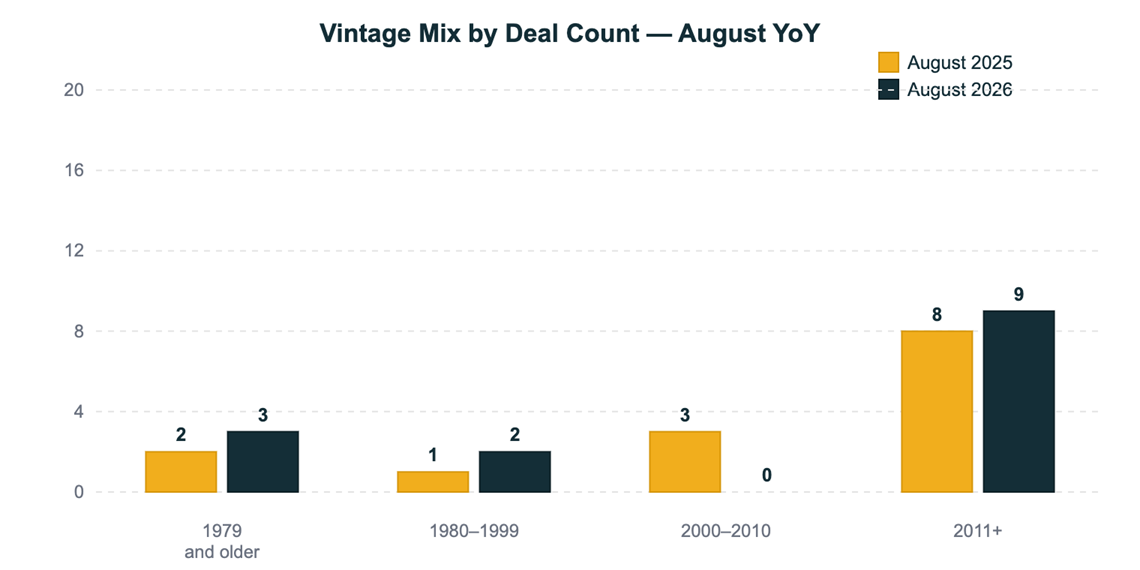
By count, the 2011+ band commanded 60% of activity (9 of 15 tracked deals).
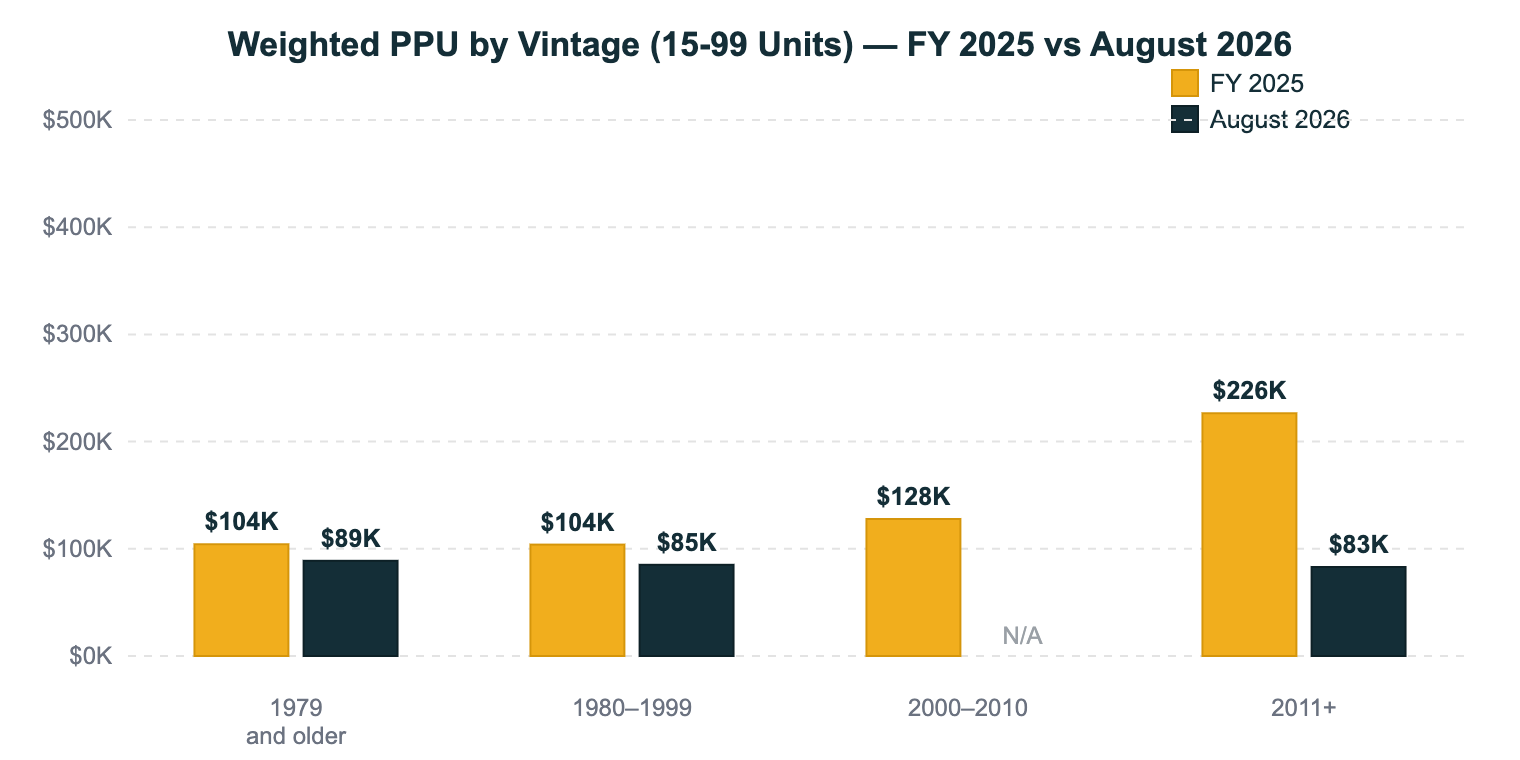
Pricing Trends (15 to 99 Units): $86,673/unit weighted across 6 deals.
By vintage in the 15 to 99 unit cohort: 1979 and older at $88,889/unit (2 deals), -16.7% YoY; 1980–1999 at $85,081/unit (2 deals), -12.5% YoY.
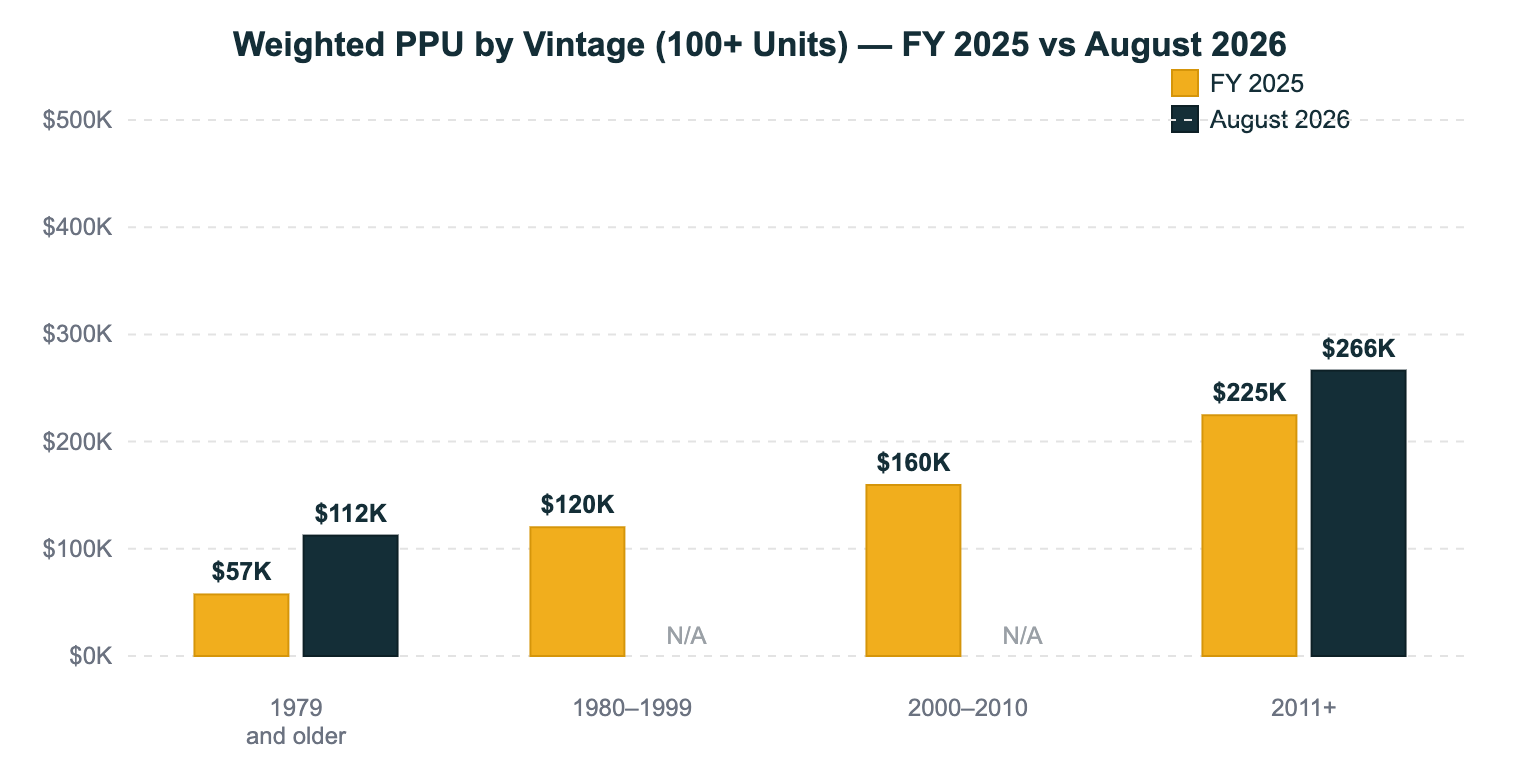
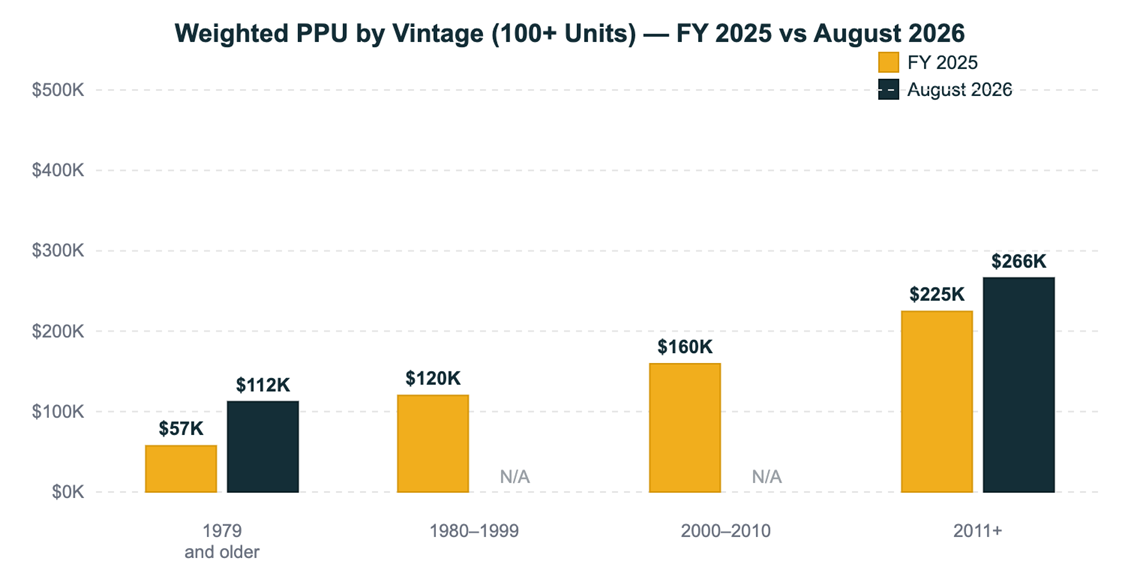
Pricing Trends (100+ Units): $228,346/unit weighted across 9 deals, +25.4% versus a year ago.
By vintage in the 100+ unit cohort: 1979 and older at $112,321/unit (1 deal); 2011+ at $266,157/unit (7 deals), +14.8% YoY.
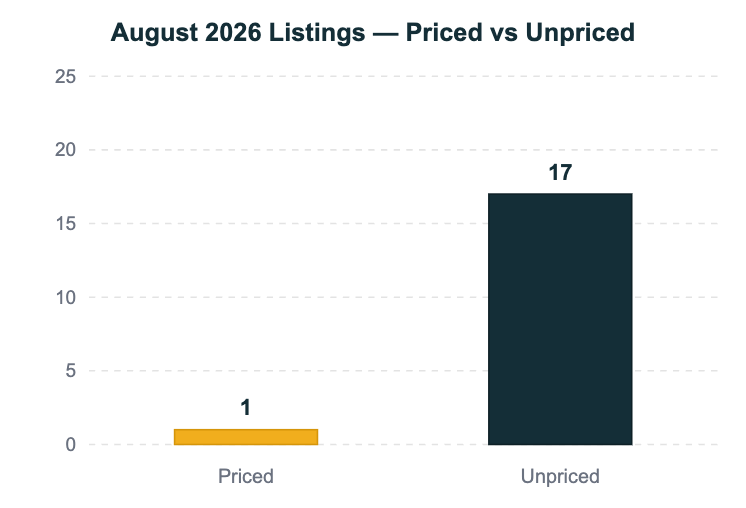
On the listing side, 18 new deals came to market (1 priced, 17 unpriced), meaning 94% arrived without a number on them.
Through August, NC has closed $2,645,903,158 YTD, which annualizes to $3,968,854,737 for 2026. That puts the state on pace for -31.4% against 2025's full-year $5,785,639,377.
The war continues to drag on, and the resulting energy crisis continues to add inflationary pressure. Gas was nearly $4.20 per gallon in Charlotte this morning, and I saw a stat recently that credit card delinquencies across all age ranges have doubled since 2021, meaning the average renter continues to remain under continued pressure.
On another note, the Fed raised the overnight rate by 25 basis points in this month's meeting, with another hike expected before year-end and one or two more projected in 2027. One thing that stands out is that foreign investors have dialed back their exposure to US debt securities and have shifted their exposure to heavier in US equities. That can mean a few things, but at its simplest level it could signal that foreign investors believe that yields need to be higher to loan money to the US Government. The reality is that someone is going to have to absorb that supply, and to attract those buyers (outside of the US buying their own debt which is a different conversation) yields may have to stay higher.
What is interesting is that over the past few years groups who have been waiting for a better exit have been using short-term bridge debt as a mechanism to buy more time. Selling today may mean accepting a suboptimal return, while refinancing into long-term debt can require a meaningful equity contribution because the proceeds don’t work. Bridge debt, priced off the short end of the curve, has allowed these groups to wait for lower rates or stronger fundamentals to improve their position. As the Fed pushes overnight rates higher, buying that time becomes more expensive, and more owners may ultimately decide to accept the current market and transact.
I’ve said for a while, but unfortunately higher rates may actually be what the market needs to stabilize and move toward the next cycle. Based on what we are seeing and hearing in the NC multifamily market, it would seem that we are headed in that direction.
Total 2026 transaction volume will finish roughly 20% below 2025. Sep-Dec volume will land at ~2B, and Q4 volume will be driven largely by newer vintage sales.
The unfortunate reality is that there is a decent probability that things get worse from here and stay that way for longer than anyone would like… So I'll continue to say it, operations remain the most important factor in this market.
If you have time and the ability to be patient, I would sit tight and wait. I believe the market will eventually reward that patience. If you have a pending maturity, evaluate your options early so you have time to make the best decision you can.
Even with the 10-year Treasury at 5.238%, debt and liquidity are still available… they’re just selective. Every valuation and exit expectation in the NC multifamily market needs to reflect today’s cost of capital.





Closings & Volume
| Metric | August 2026 | August 2025 | YoY Variance |
|---|---|---|---|
| Total Deals Sold | 15 | 14 | +7.1% |
| Total Volume | $622,392,000 | $534,196,000 | +16.5% |
| Average Deal Size | $41,492,800 | $38,156,857 | +8.7% |
Month over Month Snapshot (July → August 2026)
| Metric | July | August | MoM |
|---|---|---|---|
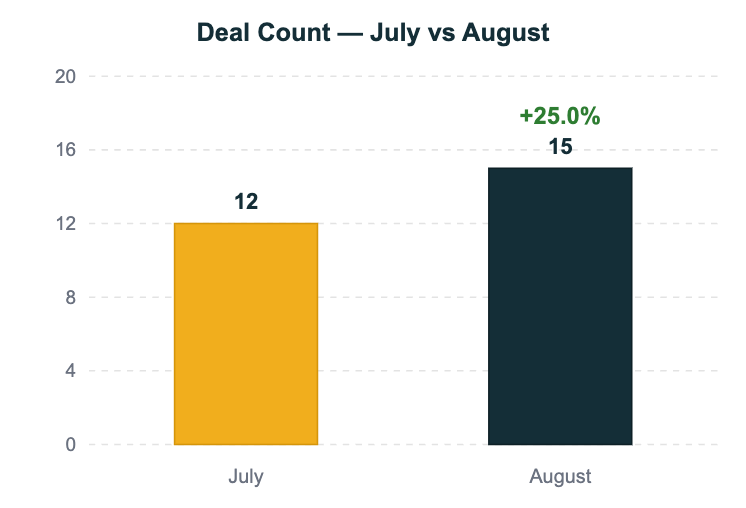
| Deal Count | 12 | 15 | +25.0% |
| Volume | $392,243,000 | $622,392,000 | +58.7% |
| Avg Deal Size | $32,686,917 | $41,492,800 | +26.9% |
Deal Size & Unit Count
| Metric | August 2026 | August 2025 | Variance |
|---|---|---|---|
| Average Unit Count | 192.1 | 213.0 | -9.8% |
| Average Vintage | 2004 | 2007 | -3 yrs |
FY 2025 vs August 2026; 15–99 Unit Deals
| Vintage | FY 2025 | August 2026 | Variance |
|---|---|---|---|
| Overall | $132K (101 deals) | $87K (6 deals) | -34.2% |
| 1979 and older | $104K (43) | $89K (2) | -14.8% |
| 1980–1999 | $104K (29) | $85K (2) | -18.1% |
| 2000–2010 | $128K (12) | N/A | N/A |
| 2011+ | $226K (17) | $83K (2) | -63.3% |
FY 2025 vs August 2026; 100+ Unit Deals
| Vintage | FY 2025 | August 2026 | Variance |
|---|---|---|---|
| Overall | $172K (121 deals) | $228K (9 deals) | +33.0% |
| 1979 and older | $57K (14) | $112K (1) | +95.7% |
| 1980–1999 | $120K (31) | N/A | N/A |
| 2000–2010 | $160K (18) | N/A | N/A |
| 2011+ | $225K (58) | $266K (7) | +18.5% |
Breakdown of Deals Sold by Vintage
| Vintage | August 2026 | August 2025 |
|---|---|---|
| 1979 and older | 20.0% (3 of 15) | 14.3% (2 of 14) |
| 1980–1999 | 13.3% (2 of 15) | 7.1% (1 of 14) |
| 2000–2010 | 0.0% (0 of 15) | 21.4% (3 of 14) |
| 2011+ | 60.0% (9 of 15) | 57.1% (8 of 14) |
Breakdown of Deals Sold by Unit Count
| Size | August 2026 | August 2025 |
|---|---|---|
| Sub-100 units | 40.0% (6 of 15) | 35.7% (5 of 14) |
| 100+ units | 60.0% (9 of 15) | 64.3% (9 of 14) |
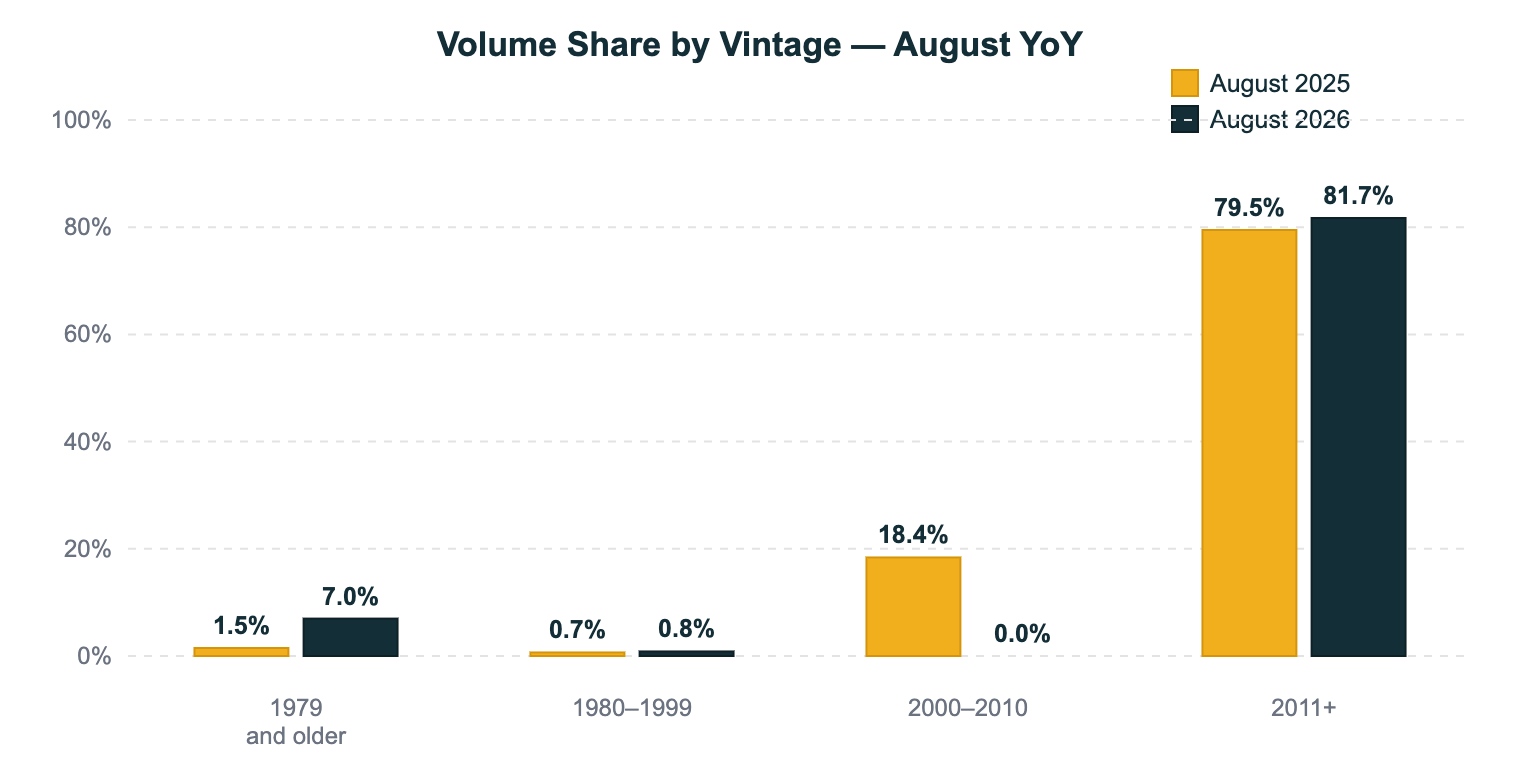
Transaction Volume by Vintage Band
| Vintage | August 2026 | August 2025 |
|---|---|---|
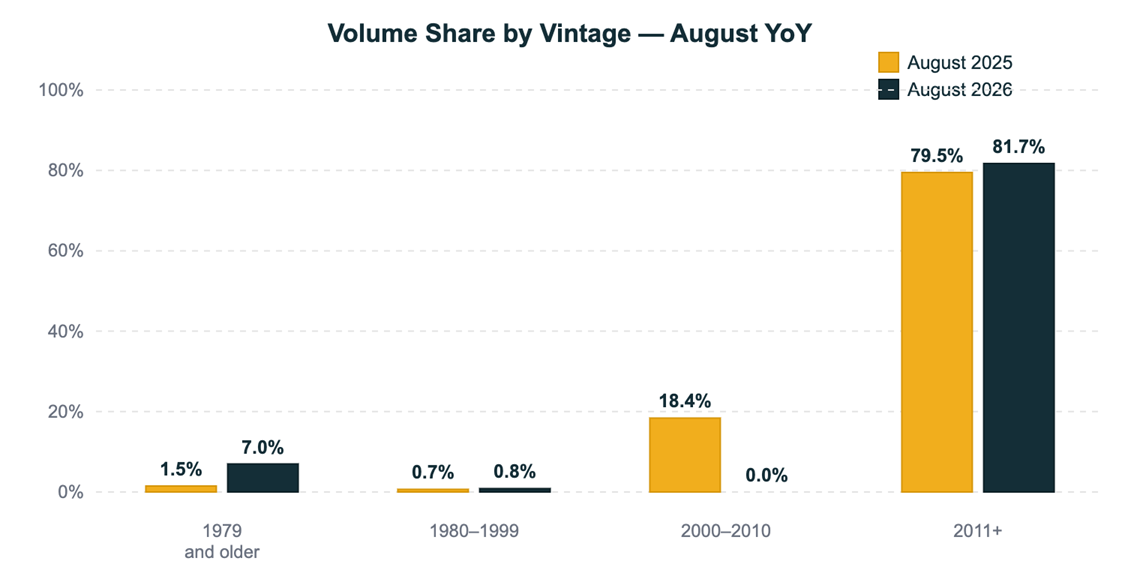
| 1979 and older | $43,450,000 (7.0%) | $7,900,000 (1.5%) |
| 1980–1999 | $5,275,000 (0.8%) | $3,500,000 (0.7%) |
| 2000–2010 | $0 (0.0%) | $98,236,000 (18.4%) |
| 2011+ | $508,667,000 (81.7%) | $424,560,000 (79.5%) |
Average Deal Size by Vintage
| Vintage | August 2026 | August 2025 |
|---|---|---|
| 1979 and older | $14,483,333 | $3,950,000 |
| 1980–1999 | $2,637,500 | $3,500,000 |
| 2000–2010 | N/A | $32,745,333 |
| 2011+ | $56,518,556 | $53,070,000 |
Average Unit Count by Vintage
| Vintage | August 2026 | August 2025 |
|---|---|---|
| 1979 and older | 138 units | 37 units |
| 1980–1999 | 31 units | 36 units |
| 2000–2010 | N/A | 342 units |
| 2011+ | 217 units | 231 units |
Listings
New Listings; 18 total (1 priced, 17 unpriced)
| Market | Units | Yr Built | Ask | Listed |
|---|---|---|---|---|
| Charlotte | 549 | 2021 | Unpriced | 2026-08-05 |
| Charlotte | 310 | 2024 | Unpriced | 2026-08-24 |
| Charlotte | 301 | 2025 | Unpriced | 2026-08-11 |
| Wendell | 288 | 2021 | Unpriced | 2026-08-06 |
| Charlotte | 282 | 2000 | Unpriced | 2026-08-31 |
| Charlotte | 276 | 1990 | Unpriced | 2026-08-25 |
| Cary | 259 | 2023 | Unpriced | 2026-08-03 |
| Charlotte | 210 | 2025 | Unpriced | 2026-08-12 |
| Winston-Salem | 198 | 1969 | Unpriced | 2026-08-18 |
| Greenville | 194 | ? | Unpriced | 2026-08-27 |
| Raleigh | 186 | 2025 | Unpriced | 2026-08-19 |
| Jacksonville | 154 | 1972 | Unpriced | 2026-08-03 |
| Mills River | 148 | 2025 | Unpriced | 2026-08-17 |
| Charlotte | 108 | 2002 | Unpriced | 2026-08-12 |
| Ocean Isle Beach | 108 | 2025 | Unpriced | 2026-08-17 |
| Charlotte | 102 | 2025 | Unpriced | 2026-08-10 |
| Stanley | 30 | 1989 | $3,799,000 | 2026-08-10 |
| Hendersonville | ? | 2025 | Unpriced | 2026-08-20 |
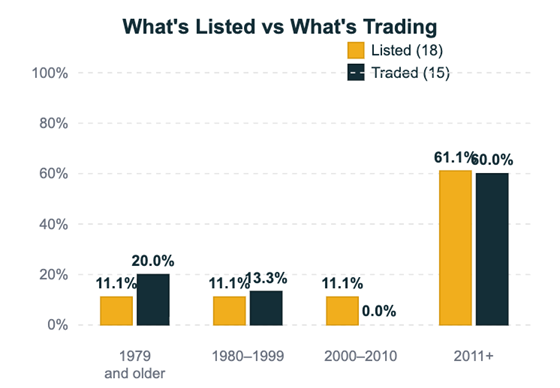
What’s Being Listed vs What’s Actually Trading
| Vintage | Listed | Traded |
|---|---|---|
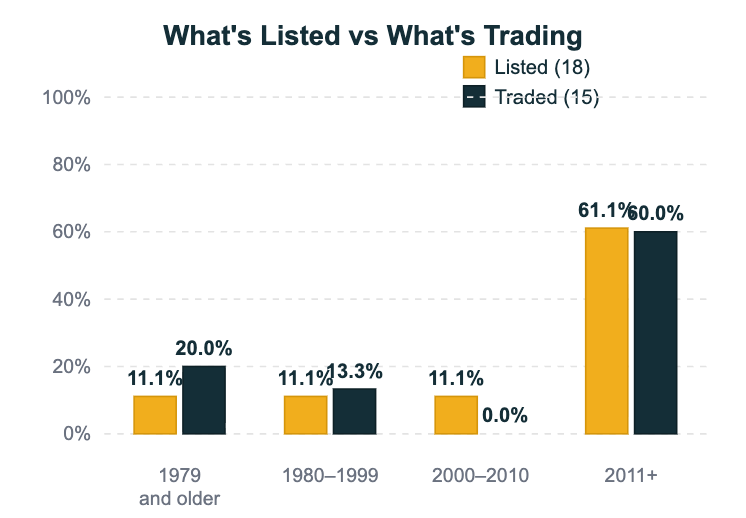
| 1979 and older | 2 of 18 (11.1%) | 20.0% of closings |
| 1980–1999 | 2 of 18 (11.1%) | 13.3% of closings |
| 2000–2010 | 2 of 18 (11.1%) | 0.0% of closings |
| 2011+ | 11 of 18 (61.1%) | 60.0% of closings |
2026 YTD Volume
| Month | Volume |
|---|---|
| January | $414,950,000 |
| February | $197,624,000 |
| March | $142,660,800 |
| April | $358,291,858 |
| May | $279,198,000 |
| June | $238,543,500 |
| July | $392,243,000 |
| August | $622,392,000 |
| YTD | $2,645,903,158 |
| Annualized | $3,968,854,737 |
Figures reflect the most complete records available at publication. Some sales record on a lag, so prior months are revised as they settle. FY 2025 is restated to $5,785,639,377 from $5,720,489,674, mainly reflecting one $71,300,000 sale confirmed as a December 2025 closing.
Source: CoStar, public listings, property websites, local planning records, and Aline Capital research.
Partner with us to navigate the complexities of commercial real estate. Get in touch today to explore how our expertise can unlock the full potential of your real estate investments.