

By: Alex Rossitch
Welcome to the 3rd edition of “On the Move”. Our mission is simple, to track the data and trends around 15+ unit market rate multifamily transactions in the state of NC each month. We will be watching new deals listed, what sold, and what capital markets conditions exist so you are always up to date on the state of the market, and equipped to make the best decisions.
Late Cycle Bottoming → Early Recovery (with macro risk)
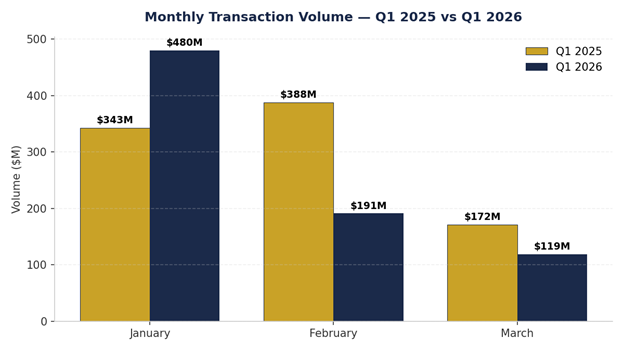
36 transactions totaling $790,982,800 in Q1 2026. Down 5.3% in deal count and 12.4% in volume year over year.
March closed just 8 deals for $119,260,800, continuing a steady decline from February’s 11 deals and $191,360,000. Deal count fell 27.3% and volume fell 37.7% month over month.
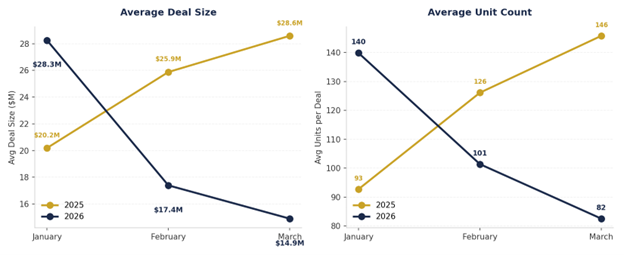
Average deal size fell from $28,256,588 in January to $17,396,364 in February to $14,907,600 in March.
Average unit count per deal fell 41.4% from January to March 2026 (140 to 82)
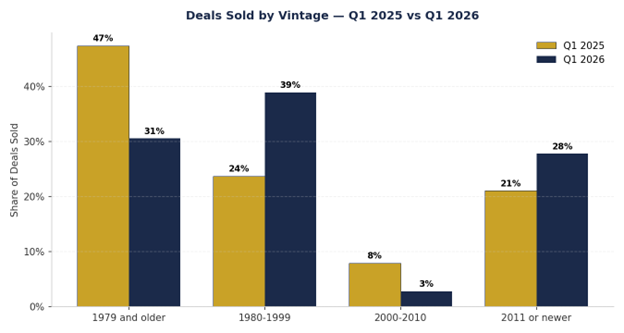
1980–1999 vintage accounted for 38.9% of Q1 closings, up from 23.7% in Q1 2025. 1979 and older dropped from 47.4% to 30.6%.
2011 or newer product represented just 27.8% of deals but commanded 64.3% of total volume.
Average Vintage (Q1 2026) — 1990 | (Q1 2025) — 1986
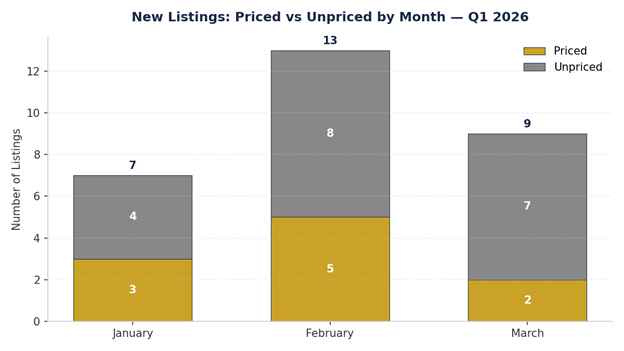
65.5% of Q1 listings came to market unpriced.
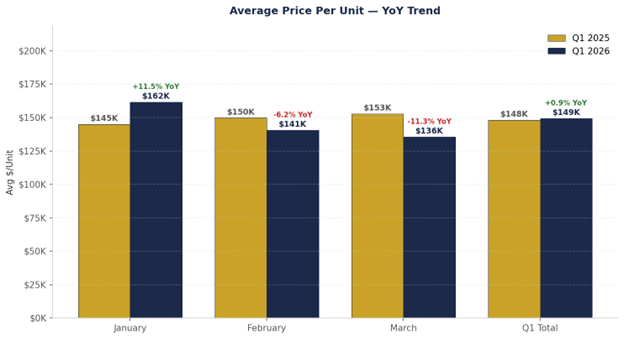
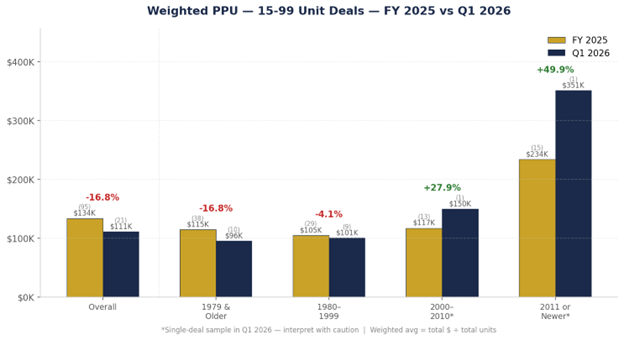
Pricing Trends — (15–99 Units): PPU fell 16.75% vs FY 2025, from $134K/unit to $111K/unit across 21 deals.
1979 and older product drove the decline, dropping 16.77% ($115K → $96K), while 1980–1999 held tighter at -4.1% ($105K → $101K).
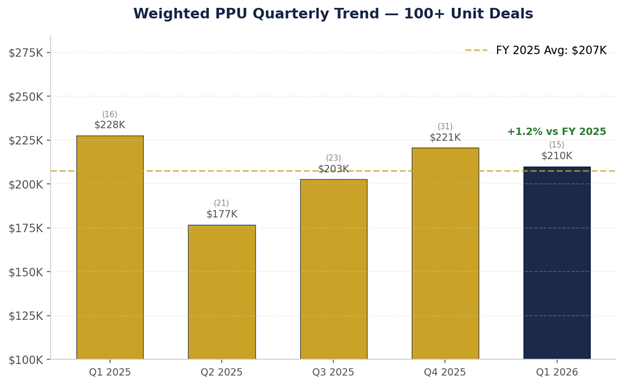
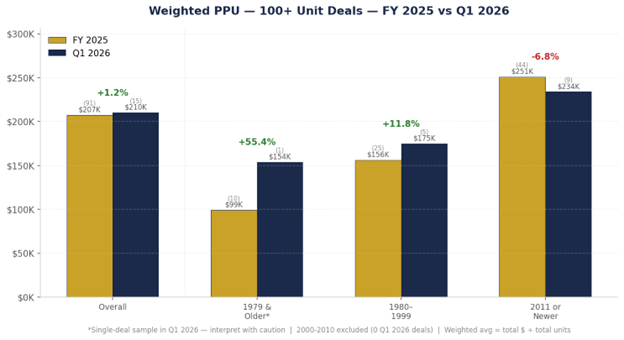
Pricing Trends — (100+ Units): PPU held flat at +1.2% vs FY 2025 ($207K → $210K) across 15 deals.
The 1980–1999 band showed strength at +11.8% ($156K → $175K on 5 deals), while 2011+ product softened 6.8% ($251K → $234K on 9 deals)
MBA forecasts multifamily originations to reach ~$399B in 2026, up from ~$330B in 2025. Lending activity has increased for six straight quarters. Capital is available for deals priced to today’s cost of capital.
Despite ongoing geopolitical tensions, capital markets have quietly improved over the past few weeks, and arguably more importantly, the market is not currently pricing in the worst case scenario with peace talks in the air. On the credit front, lower rated junk bond spreads moved from just over 1,000 bps in late March to ~916 as of this writing. Treasury yields have drifted slightly lower from the March 27th highs, with the 10yr currently sitting at 4.248. That being said, a high level of uncertainty in the near term remains despite peace talks, and we could see a dramatic shift with one bad headline.
At the same time, “Dr. Copper”, which has historically led economic slowdowns, is holding firm and remains up year over year. That suggests the underlying economy is more resilient than headlines imply, but time will tell if that holds.
On the ground, fundamentals remain tight. Operating costs continue to pressure returns, and higher supply markets continue to feel rent and concession pressure. Supply, however, is rolling over in a meaningful way and is expected to remain well below the peak through 2028.
With roughly $10 trillion in Treasury debt, ~$3 trillion in corporate debt, and CRE maturities estimated as high as $1.8 trillion in 2026, there is real incentive to keep capital markets functioning, but policy alone can’t correct a cracking system. The one current unknown is what the endgame looks like for the wall of loans that have been extended and continue to be.
Last Month’s Call: I said 2026 volume was unlikely to match 2025 if the 10yr hovered around 4.3% for 90 days. Q1 2026 annualized volume suggests we land at roughly 3.16b, but we are headed into the historically busier half of the year, so I expect we make up some ground.
This Month’s Call: The market has likely passed its pricing bottom, but not evenly. Larger deals appear to be stabilizing first, while smaller and older assets are still working through price discovery. Until that gap closes, pricing will remain uneven, and I do not expect consistent upward pricing across the market until early-mid 2027.
Risk to This View: Energy prices move higher. If inflation reaccelerates and works deeper into the economy, rates will stay elevated, slowing transaction activity and delaying pricing recovery, particularly for smaller and older assets still working through price discovery.
Operating fundamentals matter more than ever, and timing decisions should be made with capital markets, not just property performance, in mind. The deals getting done, and more importantly, finding a competitive environment in the market, are the ones priced to today’s cost of capital.
Writing this I am reminded of an old saying, “It’s better to be roughly right than precisely wrong”. In today’s environment you have to focus on what you can control, and the uncertainty around the geopolitical climate poses a high level of near term risk. It’s easy to tell ourselves the market will be better in 6 months, but the reality is that as stewards of capital and assets, our job is to limit risk, and in this case hedge against uncertainty.
So in short, if your business plan hinges on an exit in the next ~6-9 months, or more specifically you have a debt maturity in that window, I would recommend starting that process today due to macro uncertainty. Today is transactable with the right approach, but as we’ve seen, things can shift quickly.
If your debt maturity wall is further out, you could be entering a solid refinance or sale window starting in early-mid 2027.
For owners of assets between 15–99, particularly 1979 and older vintage, pricing pressure is still working through the market, so positioning and expectations matter more than ever as buyers remain highly selective.
Closings
Total Deals Sold — 36 YoY Variance (Q1 2026 vs. Q1 2025) — -5.3% (38 deals in Q1 2025) MoM Trend — 17 (Jan) → 11 (Feb) → 8 (Mar)
Volume
Total Volume — $790,982,800 YoY Variance — -12.4% ($902,886,734 in Q1 2025) MoM Trend — $480,362,000 (Jan) → $191,360,000 (Feb) → $119,260,800 (Mar)
Deal Size & Unit Count
Average Deal Size — $21,971,744 YoY Variance — -7.5% ($23,760,177 in Q1 2025) MoM Trend — $28,256,588 (Jan) → $17,396,364 (Feb) → $14,907,600 (Mar)
Average Unit Count — 115.4 units YoY Variance — +0.9% (114.3 units in Q1 2025) MoM Trend — 139.9 (Jan) → 101.4 (Feb) → 82.5 (Mar)
Average Vintage — 1990 Q1 2025 — 1986
PPU Quarterly Trend — 15–99 Unit Deals
Q1 2025 — $101K/unit (22 deals, 678 units) Q2 2025 — $149K/unit (19 deals, 908 units) Q3 2025 — $149K/unit (20 deals, 973 units) Q4 2025 — $130K/unit (34 deals, 1,716 units) Q1 2026 — $111K/unit (21 deals, 825 units) FY 2025 Weighted Avg — $134K/unit | Q1 2026 vs FY 2025: -16.8%
Quarterly Trend — 100+ Unit Deals
Q1 2025 — $228K/unit (16 deals, 3,665 units) Q2 2025 — $177K/unit (21 deals, 4,806 units)
Q3 2025 — $203K/unit (23 deals, 5,070 units) Q4 2025 — $221K/unit (31 deals, 7,292 units)
Q1 2026 — $210K/unit (15 deals, 3,328 units) FY 2025 Weighted Avg — $207K/unit | Q1 2026 vs FY 2025: +1.2%
FY 2025 vs Q1 2026 — 15-99 Unit Deals
Overall — FY 2025 $134K/unit (95 deals, 4,275 units) → Q1 2026 $111K/unit (21 deals, 825 units) | -16.75% 1979 and older — $115K → $96K | -16.77% (38 vs 10 deals) 1980–1999 — $105K → $101K | -4.1% (29 vs 9 deals) 2000–2010 — $117K → $150K | +27.9% (13 vs 1 deal*) 2011 or newer — $234K → $351K | +49.9% (15 vs 1 deal*)
*Single-deal sample — interpret with caution
FY 2025 vs Q1 2026 — 100+ Unit Deals
Overall — FY 2025 $207K/unit (91 deals, 20,833 units) → Q1 2026 $210K/unit (15 deals, 3,328 units) | +1.2% 1979 and older — $99K → $154K | +55.4% (10 vs 1 deal*) 1980–1999 — $156K → $175K | +11.8% (25 vs 5 deals) 2000–2010 — $208K → no Q1 2026 deals (12 vs 0) 2011 or newer — $251K → $234K | -6.8% (44 vs 9 deals)
*Single-deal sample — interpret with caution
Breakdown of Deals Sold by Vintage
1979 and older — 30.6% (11 of 36) vs. 47.4% (18 of 38) in Q1 2025
1980–1999 — 38.9% (14 of 36) vs. 23.7% (9 of 38) in Q1 2025
2000–2010 — 2.8% (1 of 36) vs. 7.9% (3 of 38) in Q1 2025
2011 or newer — 27.8% (10 of 36) vs. 21.1% (8 of 38) in Q1 2025
Breakdown of Deals Sold by Unit Count
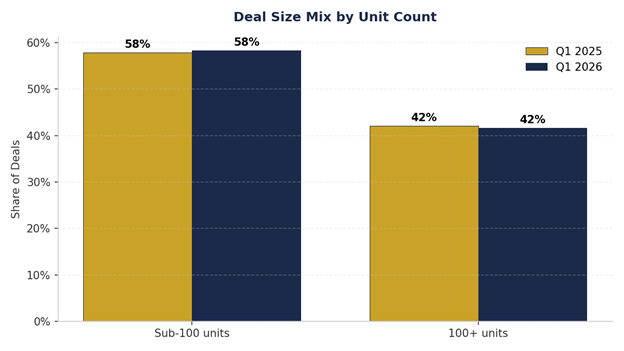
Sub-100 units — 58.3% (21 of 36) vs. 57.9% (22 of 38) in Q1 2025
100+ units — 41.7% (15 of 36) vs. 42.1% (16 of 38) in Q1 2025
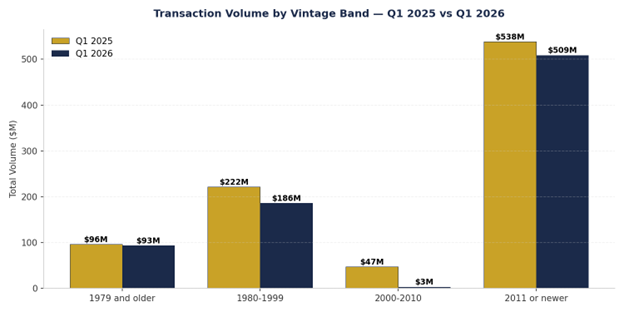
Transaction Volume by Vintage Band
1979 and older — $93.3M (11.8% of vol) vs. $96.1M (10.6%) in Q1 2025
1980–1999 — $186.0M (23.5% of vol) vs. $221.6M (24.5%) in Q1 2025
2000–2010 — $3.0M (0.4% of vol) vs. $46.9M (5.2%) in Q1 2025
2011 or newer — $508.7M (64.3% of vol) vs. $538.3M (59.6%) in Q1 2025
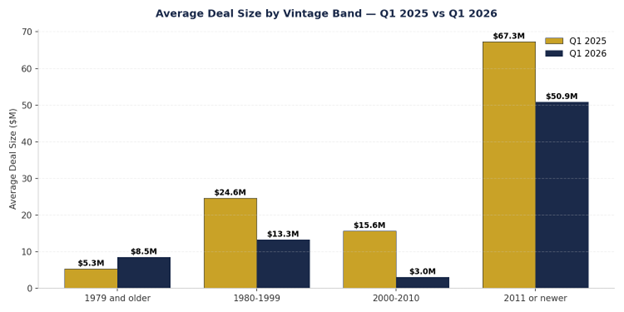
Average Deal Size by Vintage
1979 and older — $8.5M vs. $5.3M in Q1 2025
1980–1999 — $13.3M vs. $24.6M in Q1 2025
2000–2010 — $3.0M vs. $15.6M in Q1 2025
2011 or newer — $50.9M vs. $67.3M in Q1 2025
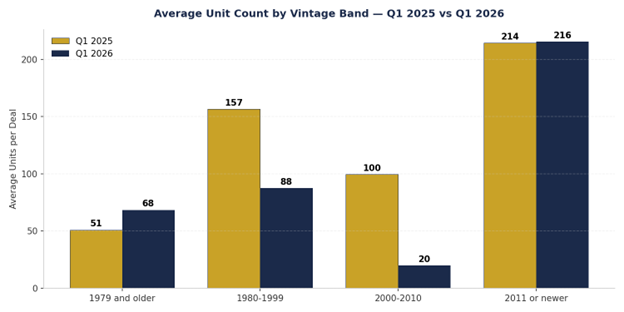
Average Unit Count by Vintage
1979 and older — 68 units vs. 51 in Q1 2025
1980–1999 — 88 units vs. 157 in Q1 2025
2000–2010 — 20 units vs. 100 in Q1 2025
2011 or newer — 216 units vs. 214 in Q1 2025
Listings
New Listings — 29 total (10 priced, 19 unpriced) MoM Trend — 7 (Jan) → 13 (Feb) → 9 (Mar)
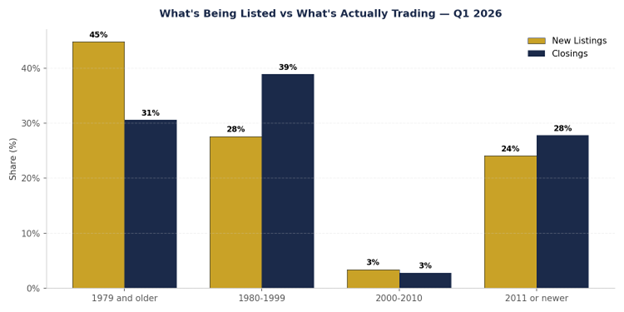
What’s Being Listed vs What’s Actually Trading
1979 and older — 44.8% of listings (13 of 29) vs. 30.6% of closings (11 of 36)
1980–1999 — 27.6% of listings (8 of 29) vs. 38.9% of closings (14 of 36)
2000–2010 — 3.4% of listings (1 of 29) vs. 2.8% of closings (1 of 36)
2011 or newer — 24.1% of listings (7 of 29) vs. 27.8% of closings (10 of 36)
Partner with us to navigate the complexities of commercial real estate. Get in touch today to explore how our expertise can unlock the full potential of your real estate investments.