


Welcome to the 7th edition of “On the Move”. Our mission is simple, to track the data and trends around 15+ unit market rate multifamily transactions in the state of NC each month. We will be watching new deals listed, what sold, and what capital markets conditions exist so you are always up to date on the state of the market, and equipped to make the best decisions.
Late Cycle
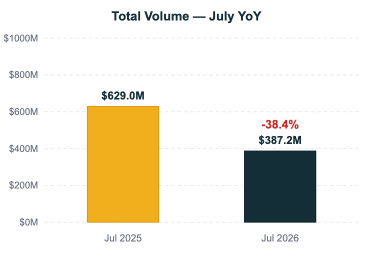
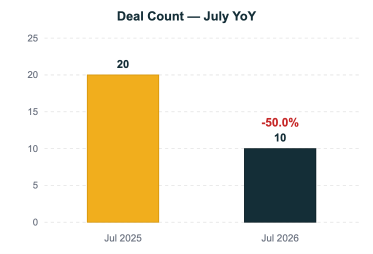
10 transactions totaling $387,243,000 closed across NC in July 2026. That is -50.0% in deal count and -38.4% in volume against July 2025.
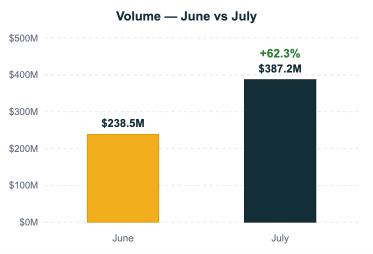
Against the prior month, volume moved +62.3% from $238,543,500 in June to $387,243,000.
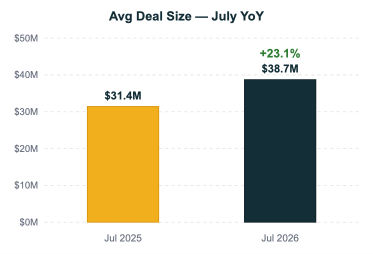
Average deal size landed at $38,724,300, +23.1% year over year.
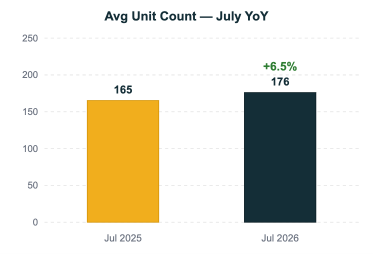
Average unit count on the deals I track in detail was 176 units, +6.5% year over year (versus 165 a year ago).
The average vintage of what traded was 1996, 3 years older than the 1999 that traded a year ago.
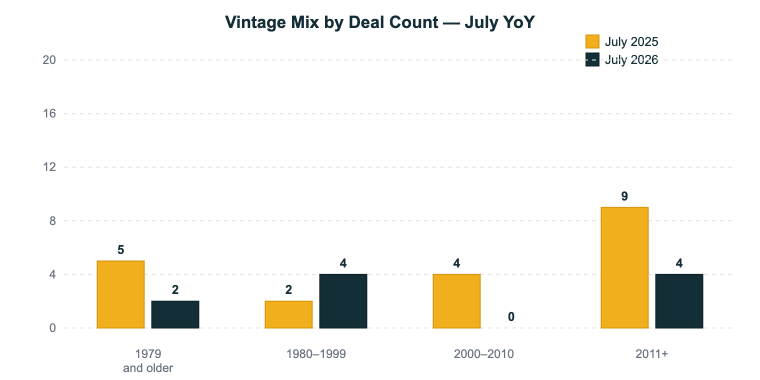
By count, the 2011+ band commanded 40% of activity (4 of 10 tracked deals).
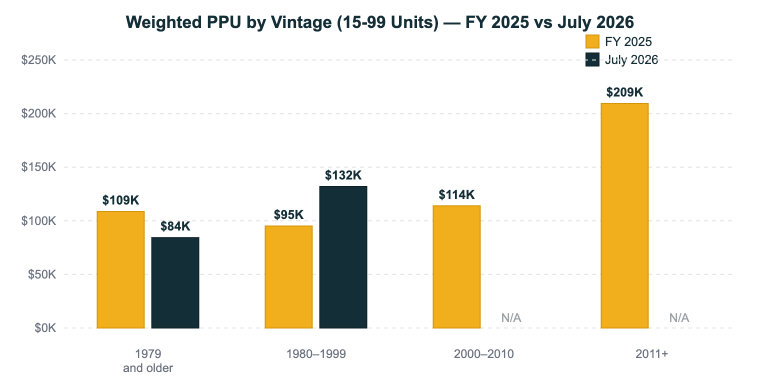
Pricing Trends (15 to 99 Units): $103,046/unit weighted across 4 deals, -13.2% versus a year ago.
By vintage in the 15 to 99 unit cohort: 1979 and older at $84,366/unit (2 deals), -0.9% YoY; 1980–1999 at $132,000/unit (2 deals), -5.0% YoY.
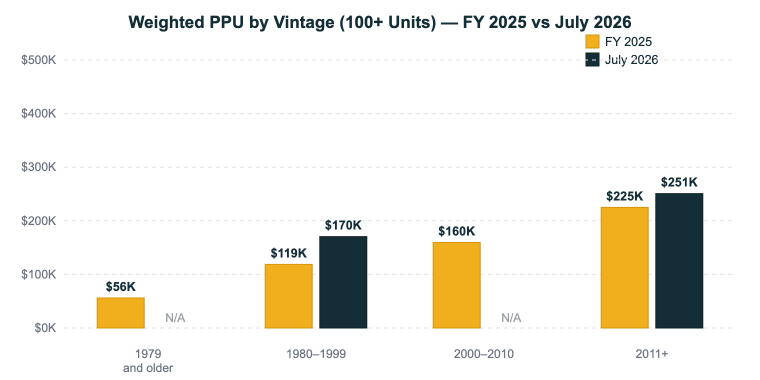
Pricing Trends (100+ Units): $231,018/unit weighted across 6 deals, +14.7% versus a year ago.
By vintage in the 100+ unit cohort: 1980–1999 at $170,455/unit (2 deals), -2.6% YoY; 2011+ at $250,806/unit (4 deals), -0.3% YoY.
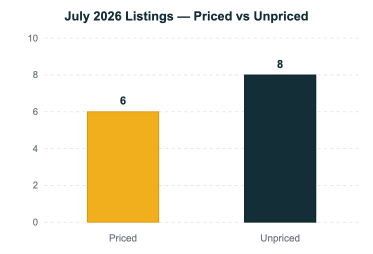
On the listing side, 14 new deals came to market (6 priced, 8 unpriced), meaning 57% arrived without a number on them.
Through July, NC has closed $2,083,106,158 YTD, which annualizes to $3,571,039,128 for 2026. That puts the state on pace for -37.6% against 2025’s full-year $5,720,489,674.
After months of deal, no deal, and geopolitical whiplash, the Venezuela agreement that was announced Friday is a positive development, but then as is par for the course, another round of bombing happened with Iran over the weekend. If the Venezuela deal holds, that much oil coming into the equation should provide a meaningful headwind for energy prices and inflation, apparently at no cost to the taxpayer.
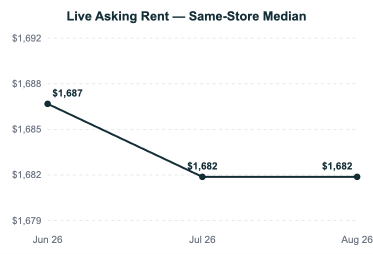
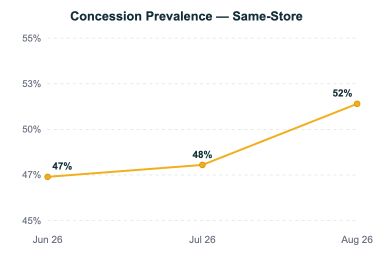
The financial state of the average renter continues to concern me… If you look at the recent earnings from Walmart, Target, Home Depot and Lowe’s, they paint an interesting picture. People are still spending, but continue to be more selective. A renter under financial pressure has less capacity to absorb rent increases, fees and unexpected expenses, so until affordability improves, I expect rent growth to remain uneven and concessions to remain part of the equation.
On the capital markets side, the Treasury Department just announced it will at least double buybacks of longer-dated Treasuries beginning in September. Looks like my call that we’d see some form of synthetic easing by the end of Q3 materialized. Not surprisingly, the initial relief in long-term yields from the headline didn’t stick, and now the market is betting there is a 63.9% chance of a hike in the September meeting.
I keep saying that three things need to happen for us to turn the corner; 1. Extend and pretend/workout wall has to start moving, 2. Groups that have been holding unrealized losses or breakeven returns come to terms with the market and start transacting, and 3. The macro and geopolitical environment have to improve, and the affordability crisis has to see some sort of shift. Until at least two of those three things happen, I think we’ll stay in a very similar spot. All that said, there does seem to be some movement on front #1 based on conversations I’ve had with several asset managers at lending institutions over the past few weeks.
Last month I said I expected activity to increase through the back half of 2026, but increasingly from pressured sellers rather than improving fundamentals, and I still believe that.
The next meaningful increase in transaction volume will happen before we see a meaningful recovery in values. I expect lender-driven sales, note sales and owners finally running out of runway to drive transaction volume between now and the end of the year.
Spreads typically widen heading into year-end, so even if long-term yields move lower in response to the buybacks, I don’t expect borrowing costs to improve by the end of the year even if there is promising movement on the geopolitical and macro front. Best case may simply be more stability around current levels.
Put bluntly, we may bounce along the bottom longer than any of us would like. I’d be evaluating your position quarterly. Debt maturity timelines, operations, upcoming capital needs and today’s value versus your basis. Waiting for the market and a rising tide to insulate your position isn’t a strategy worth banking on.
Closings & Volume
| Metric | July 2026 | July 2025 | YoY Variance |
|---|---|---|---|
| Total Deals Sold | 10 | 20 | -50.0% |
| Total Volume | $387,243,000 | $628,963,226 | -38.4% |
| Average Deal Size | $38,724,300 | $31,448,161 | +23.1% |
Month over Month Snapshot (June → July 2026)
| Metric | June | July | MoM |
|---|---|---|---|
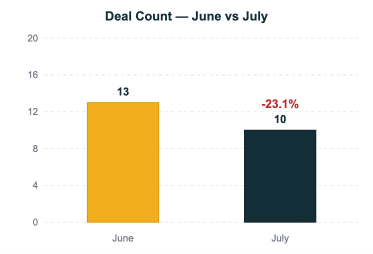
| Deal Count | 13 | 10 | -23.1% |
| Volume | $238,543,500 | $387,243,000 | +62.3% |
| Avg Deal Size | $18,349,500 | $38,724,300 | +111.0% |
Deal Size & Unit Count
| Metric | July 2026 | July 2025 | Variance |
|---|---|---|---|
| Average Unit Count | 176.1 | 165.3 | +6.5% |
| Average Vintage | 1996 | 1999 | -3 yrs |
FY 2025 vs July 2026: 15–99 Unit Deals
| Vintage | FY 2025 | July 2026 | Variance |
|---|---|---|---|
| Overall | $125K (105 deals) | $103K (4 deals) | -17.8% |
| 1979 and older | $109K (42) | $84K (2) | -22.4% |
| 1980–1999 | $95K (31) | $132K (2) | +38.7% |
| 2000–2010 | $114K (14) | N/A | N/A |
| 2011+ | $209K (18) | N/A | N/A |
FY 2025 vs July 2026: 100+ Unit Deals
| Vintage | FY 2025 | July 2026 | Variance |
|---|---|---|---|
| Overall | $170K (122 deals) | $231K (6 deals) | +35.8% |
| 1979 and older | $56K (15) | N/A | N/A |
| 1980–1999 | $119K (32) | $170K (2) | +43.6% |
| 2000–2010 | $160K (18) | N/A | N/A |
| 2011+ | $225K (57) | $251K (4) | +11.5% |
Breakdown of Deals Sold by Vintage
| Vintage | July 2026 | July 2025 |
|---|---|---|
| 1979 and older | 20.0% (2 of 10) | 25.0% (5 of 20) |
| 1980–1999 | 40.0% (4 of 10) | 10.0% (2 of 20) |
| 2000–2010 | 0.0% (0 of 10) | 20.0% (4 of 20) |
| 2011+ | 40.0% (4 of 10) | 45.0% (9 of 20) |
Breakdown of Deals Sold by Unit Count
| Size | July 2026 | July 2025 |
|---|---|---|
| Sub-100 units | 40.0% (4 of 10) | 45.0% (9 of 20) |
| 100+ units | 60.0% (6 of 10) | 55.0% (11 of 20) |
Transaction Volume by Vintage Band
| Vintage | July 2026 | July 2025 |
|---|---|---|
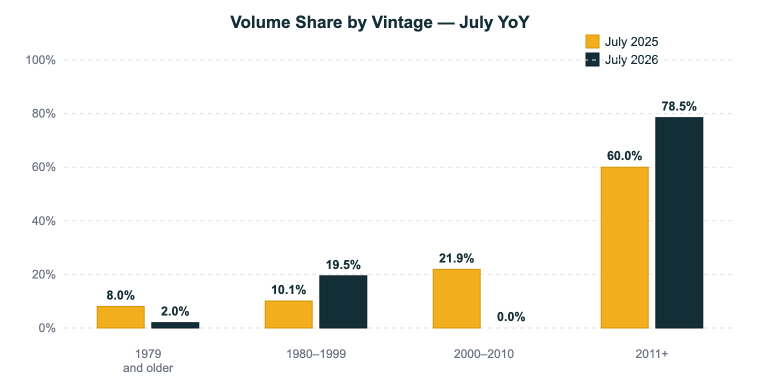
| 1979 and older | $7,846,000 (2.0%) | $50,542,279 (8.0%) |
| 1980–1999 | $75,420,000 (19.5%) | $63,258,447 (10.1%) |
| 2000–2010 | $0 (0.0%) | $137,875,000 (21.9%) |
| 2011+ | $303,977,000 (78.5%) | $377,287,500 (60.0%) |
Average Deal Size by Vintage
| Vintage | July 2026 | July 2025 |
|---|---|---|
| 1979 and older | $3,923,000 | $10,108,456 |
| 1980–1999 | $18,855,000 | $31,629,224 |
| 2000–2010 | N/A | $34,468,750 |
| 2011+ | $75,994,250 | $41,920,833 |
Average Unit Count by Vintage
| Vintage | July 2026 | July 2025 |
|---|---|---|
| 1979 and older | 46 units | 116 units |
| 1980–1999 | 114 units | 183 units |
| 2000–2010 | N/A | 196 units |
| 2011+ | 303 units | 175 units |
Listings
New Listings: 14 total (6 priced, 8 unpriced)
| Market | Units | Yr Built | Ask | Listed |
|---|---|---|---|---|
| Durham | 312 | 2008 | Unpriced | 2026-07-28 |
| Asheville | 309 | 2018 | Unpriced | 2026-07-09 |
| Archdale | 298 | 1987 | Unpriced | 2026-07-16 |
| Winston-Salem | 213 | 1985 | Unpriced | 2026-07-16 |
| Charlotte | 212 | 2014 | Unpriced | 2026-07-20 |
| Winston- Salem | 177 | 1973 | Unpriced | 2026-07-16 |
| Asheboro | 112 | 1997 | Unpriced | 2026-07-14 |
| Winston-Salem | 112 | 1984 | Unpriced | 2026-07-16 |
| Elon | 42 | 2004 | $9,500,000 | 2026-07-10 |
| Greensboro | 30 | 1966 | $2,995,000 | 2026-07-07 |
| Wilmington | 26 | 1986 | $5,300,000 | 2026-07-07 |
| Wilmington | 24 | 2007 | $6,240,000 | 2026-07-07 |
| Fayetteville | 24 | 1970 | $3,000,000 | 2026-07-17 |
| Rocky Mount | 22 | ? | $1,727,000 | 2026-07-11 |
What’s Being Listed vs What’s Actually Trading
| Vintage | Listed | Traded |
|---|---|---|
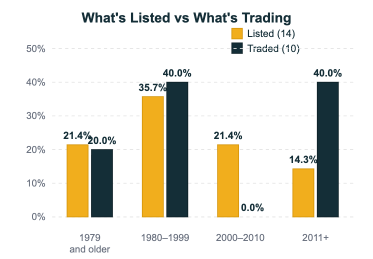
| 1979 and older | 3 of 14 (21.4%) | 20.0% of closings |
| 1980–1999 | 5 of 14 (35.7%) | 40.0% of closings |
| 2000–2010 | 3 of 14 (21.4%) | 0.0% of closings |
| 2011+ | 2 of 14 (14.3%) | 40.0% of closings |
2026 YTD Volume
| Month | Volume |
|---|---|
| January | $486,945,000 |
| February | $197,624,000 |
| March | $142,660,800 |
| April | $358,291,858 |
| May | $271,798,000 |
| June | $238,543,500 |
| July | $387,243,000 |
| YTD | $2,083,106,158 |
| Annualized | $3,571,039,128 |
Partner with us to navigate the complexities of commercial real estate. Get in touch today to explore how our expertise can unlock the full potential of your real estate investments.