


By: Alex Rossitch
Welcome to the 6th edition of “On the Move”. Our mission is simple, to track the data and trends around 15+ unit market rate multifamily transactions in the state of NC each month. We will be watching new deals listed, what sold, and what capital markets conditions exist so you are always up to date on the state of the market, and equipped to make the best decisions.
Late Cycle
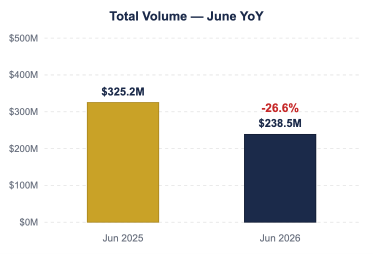
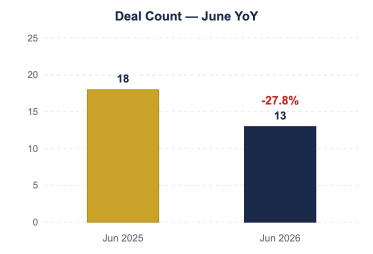
13 transactions totaling $238,543,500 closed across NC in June 2026. That is -27.8% in deal count and -26.6% in volume against June 2025.
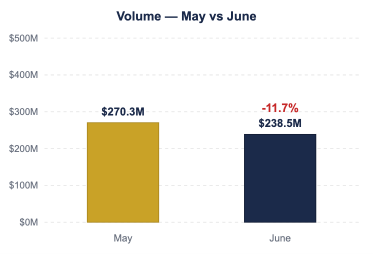
Against the prior month, volume moved -11.7% from $270,298,000 in May to $238,543,500.
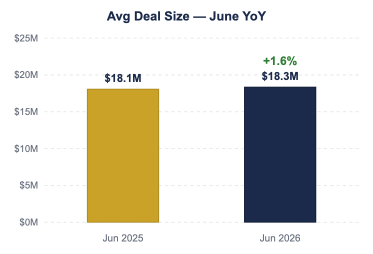
Average deal size landed at $18,349,500, +1.6% year over year.
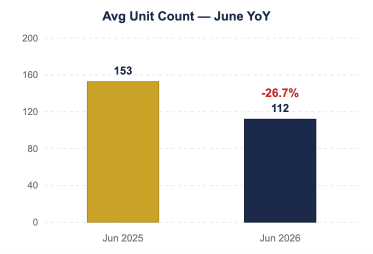
Average unit count on the deals I track in detail was 112 units, -26.7% year over year (versus 153 a year ago).
The average vintage of what traded was 1995, 3 years newer than the 1992 that traded a year ago.
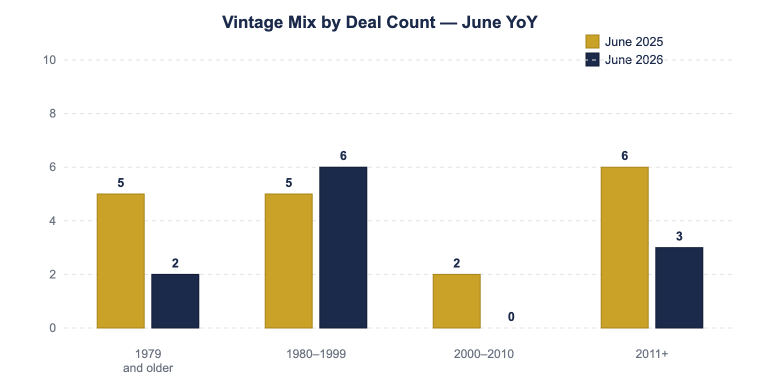
By count, the 1980–1999 band commanded 46% of activity (6 of 13 tracked deals).
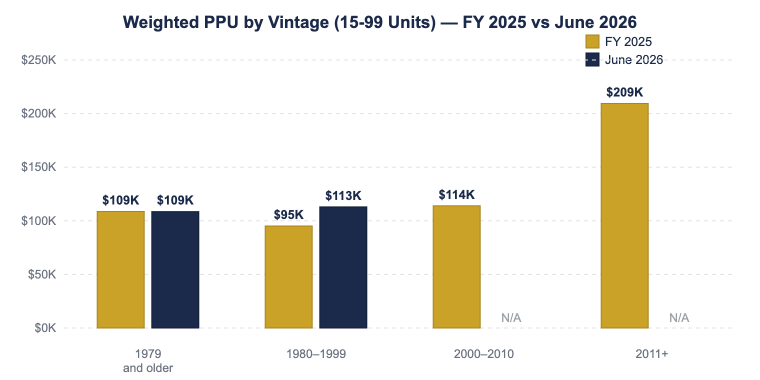
Pricing Trends (15 to 99 Units): $107,888/unit weighted across 9 deals, +16.2% versus a year ago.
By vintage in the 15 to 99 unit cohort: 1979 and older at $108,622/unit (2 deals); 1980–1999 at $112,930/unit (5 deals), -9.7% YoY.
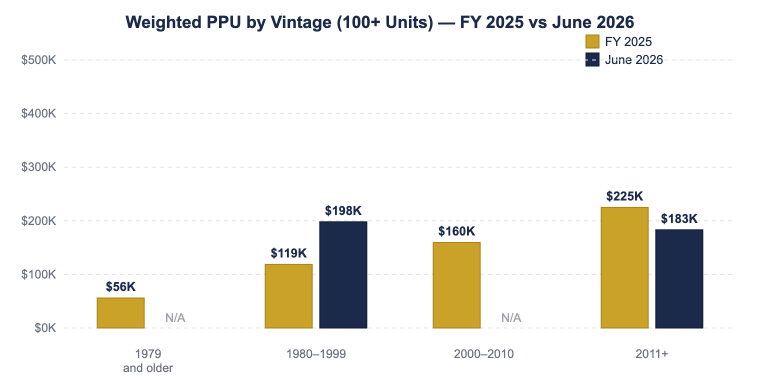
Pricing Trends (100+ Units): $185,276/unit weighted across 4 deals.
By vintage in the 100+ unit cohort: 1980–1999 at $198,214/unit (1 deal); 2011+ at $183,294/unit (3 deals).
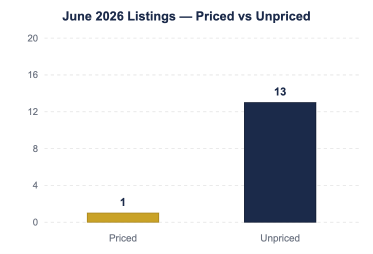
On the listing side, 14 new deals came to market (1 priced, 13 unpriced), meaning 93% arrived without a number on them.
Through June, NC has closed $1,694,363,158 YTD, which annualizes to $3,388,726,316 for 2026. That puts the state on pace for -40.8% against 2025’s full-year $5,720,489,674.
The seesaw of deal or no deal with Iran continues… It seems like every time there is a deal on the table, something happens to derail it, most recently missile strikes on a US base in Jordan yesterday. I’m not sure where this all ends, but the longer the uncertainty around this conflict remains, and long rates stay elevated, the longer the CRE market stays stuck and bouncing off the bottom. On that note, the Fed voted Wednesday to maintain its target range, but junk bond spreads are sitting at their highest level since March 15th, and while the 10yr temporarily backed off of its high from last week, as of this morning is back up to 4.641% with Crude up 7.53% since yesterday and back up at $90.24.
On the ground, asking rents and absorption are showing some signs of being in the green in select markets and submarkets, but the bottom of the renter pool is showing real signs of struggle. Based on what we are hearing in owner conversations, delinquency and evictions are climbing, especially in older vintage assets, which is the K shaped economy you keep hearing about playing out in the data. For a lot of these tenants the choice has become buying groceries or paying rent, and only one of those is essential for survival, so I expect that to continue until inflation cools meaningfully.
Based on what we’re seeing and hearing, it doesn’t feel like the market will truly turn the page until lender workouts play out, the “extend and pretend” strategy finally runs its course, and that backlog of middle market deals starts trading for what they’re actually worth. That’s when we’ll get real price discovery, and the next phase of the cycle can begin.
Despite the current headwinds, I expect December to be the most active month of the year, both in number of closings and in total volume.
If you have a debt maturity on the horizon, start those conversations as soon as possible. I’ve said it the last few months and I’ll keep saying it, because the window to get ahead of a maturity closes faster than most owners expect, and the sooner you’re in the conversation the more clarity you have around the options and paths that are available.
Beyond that, control what you can control, and in this environment that is operations. If you struggled with delinquency and evictions through Q2, you are not alone. Focus on leasing strategy, staying on top of collections, and not letting the things within your control drift while you wait on the things that aren’t. The market will return eventually, and when it does, it will reward owners with clear operational stories.
Closings & Volume
| Metric | June 2026 | June 2025 | YoY Variance |
|---|---|---|---|
| Total Deals Sold | 13 | 18 | -27.8% |
| Total Volume | $238,543,500 | $325,201,687 | -26.6% |
| Average Deal Size | $18,349,500 | $18,066,760 | +1.6% |
Month over Month Snapshot (May → June 2026)
| Metric | May | June | MoM |
|---|---|---|---|
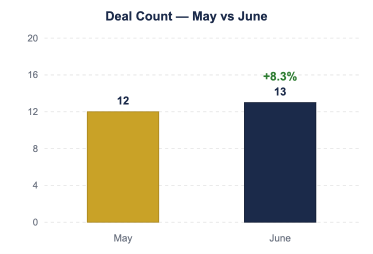
| Deal Count | 12 | 13 | +8.3% |
| Volume | $270,298,000 | $238,543,500 | -11.7% |
| Avg Deal Size | $22,524,833 | $18,349,500 | -18.5% |
Deal Size & Unit Count
| Metric | June 2026 | June 2025 | Variance |
|---|---|---|---|
| Average Unit Count | 111.9 | 152.7 | -26.7% |
| Average Vintage | 1995 | 1992 | +3 yrs |
FY 2025 vs June 2026 — 15–99 Unit Deals
| Vintage | FY 2025 | June 2026 | Variance |
|---|---|---|---|
| Overall | $125K (105 deals) | $108K (9 deals) | -14.0% |
| 1979 and older | $109K (42) | $109K (2) | -0.1% |
| 1980–1999 | $95K (31) | $113K (5) | +18.6% |
| 2000–2010 | $114K (14) | — | — |
| 2011+ | $209K (18) | — | — |
FY 2025 vs June 2026 — 100+ Unit Deals
| Vintage | FY 2025 | June 2026 | Variance |
|---|---|---|---|
| Overall | $170K (122 deals) | $185K (4 deals) | +8.9% |
| 1979 and older | $56K (15) | — | — |
| 1980–1999 | $119K (32) | $198K (1) | +67.0% |
| 2000–2010 | $160K (18) | — | — |
| 2011+ | $225K (57) | $183K (3) | -18.6% |
Breakdown of Deals Sold by Vintage
| Vintage | June 2026 | June 2025 |
|---|---|---|
| 1979 and older | 15.4% (2 of 13) | 27.8% (5 of 18) |
| 1980–1999 | 46.2% (6 of 13) | 27.8% (5 of 18) |
| 2000–2010 | 0.0% (0 of 13) | 11.1% (2 of 18) |
| 2011+ | 23.1% (3 of 13) | 33.3% (6 of 18) |
Breakdown of Deals Sold by Unit Count
| Size | June 2026 | June 2025 |
|---|---|---|
| Sub-100 units | 69.2% (9 of 13) | 38.9% (7 of 18) |
| 100+ units | 30.8% (4 of 13) | 61.1% (11 of 18) |
Transaction Volume by Vintage Band
| Vintage | June 2026 | June 2025 |
|---|---|---|
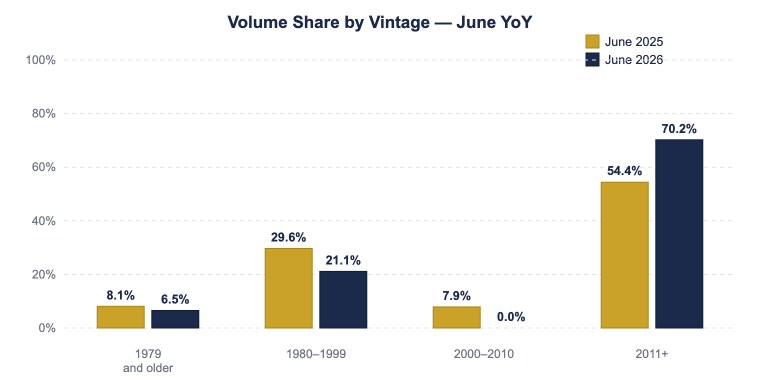
| 1979 and older | $15,533,000 (6.5%) | $26,359,687 (8.1%) |
| 1980–1999 | $50,336,000 (21.1%) | $96,419,000 (29.6%) |
| 2000–2010 | $0 (0.0%) | $25,556,000 (7.9%) |
| 2011+ | $167,530,500 (70.2%) | $176,867,000 (54.4%) |
Average Deal Size by Vintage
| Vintage | June 2026 | June 2025 |
|---|---|---|
| 1979 and older | $7,766,500 | $5,271,937 |
| 1980–1999 | $8,389,333 | $19,283,800 |
| 2000–2010 | — | $12,778,000 |
| 2011+ | $55,843,500 | $29,477,833 |
Average Unit Count by Vintage
| Vintage | June 2026 | June 2025 |
|---|---|---|
| 1979 and older | 72 units | 51 units |
| 1980–1999 | 57 units | 184 units |
| 2000–2010 | — | 84 units |
| 2011+ | 305 units | 235 units |
Listings
New Listings — 14 total (1 priced, 13 unpriced)
| Market | Units | Yr Built | Ask | Listed |
|---|---|---|---|---|
| Charlotte | 504 | 1969 | Unpriced | 2026-06-09 |
| Wilmington | 429 | 1941 | Unpriced | 2026-06-23 |
| Wilmington | 426 | 2024 | Unpriced | 2026-06-03 |
| Fayetteville | 274 | 1970 | Unpriced | 2026-06-12 |
| Wilmington | 198 | 2023 | Unpriced | 2026-06-08 |
| Raleigh | 178 | 1972 | Unpriced | 2026-06-03 |
| Concord | 160 | 1985 | Unpriced | 2026-06-29 |
| Durham | 144 | 1979 | Unpriced | 2026-06-10 |
| Charlotte | 136 | 1974 | Unpriced | 2026-06-30 |
| Charlotte | 108 | 2023 | Unpriced | 2026-06-28 |
| Chapel Hill | 87 | 1994 | Unpriced | 2026-06-09 |
| Marion | 24 | 1929 | $2,500,000 | 2026-06-05 |
| Fuquay Varina | 24 | 1998 | Unpriced | 2026-06-10 |
| Winston-Salem | 17 | 2023 | Unpriced | 2026-06-18 |
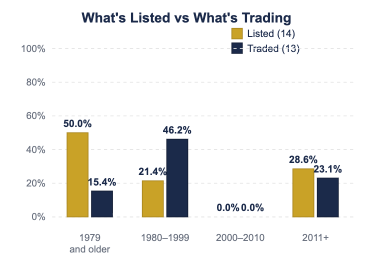
What’s Being Listed vs What’s Actually Trading
| Vintage | Listed | Traded |
|---|---|---|
| 1979 and older | 7 of 14 (50.0%) | 15.4% of closings |
| 1980–1999 | 3 of 14 (21.4%) | 46.2% of closings |
| 2000–2010 | 0 of 14 (0.0%) | 0.0% of closings |
| 2011+ | 4 of 14 (28.6%) | 23.1% of closings |
2026 YTD Volume
| Month | Volume |
|---|---|
| January | $486,945,000 |
| February | $197,624,000 |
| March | $142,660,800 |
| April | $358,291,858 |
| May | $270,298,000 |
| June | $238,543,500 |
| YTD | $1,694,363,158 |
| Annualized | $3,388,726,316 |
Partner with us to navigate the complexities of commercial real estate. Get in touch today to explore how our expertise can unlock the full potential of your real estate investments.