

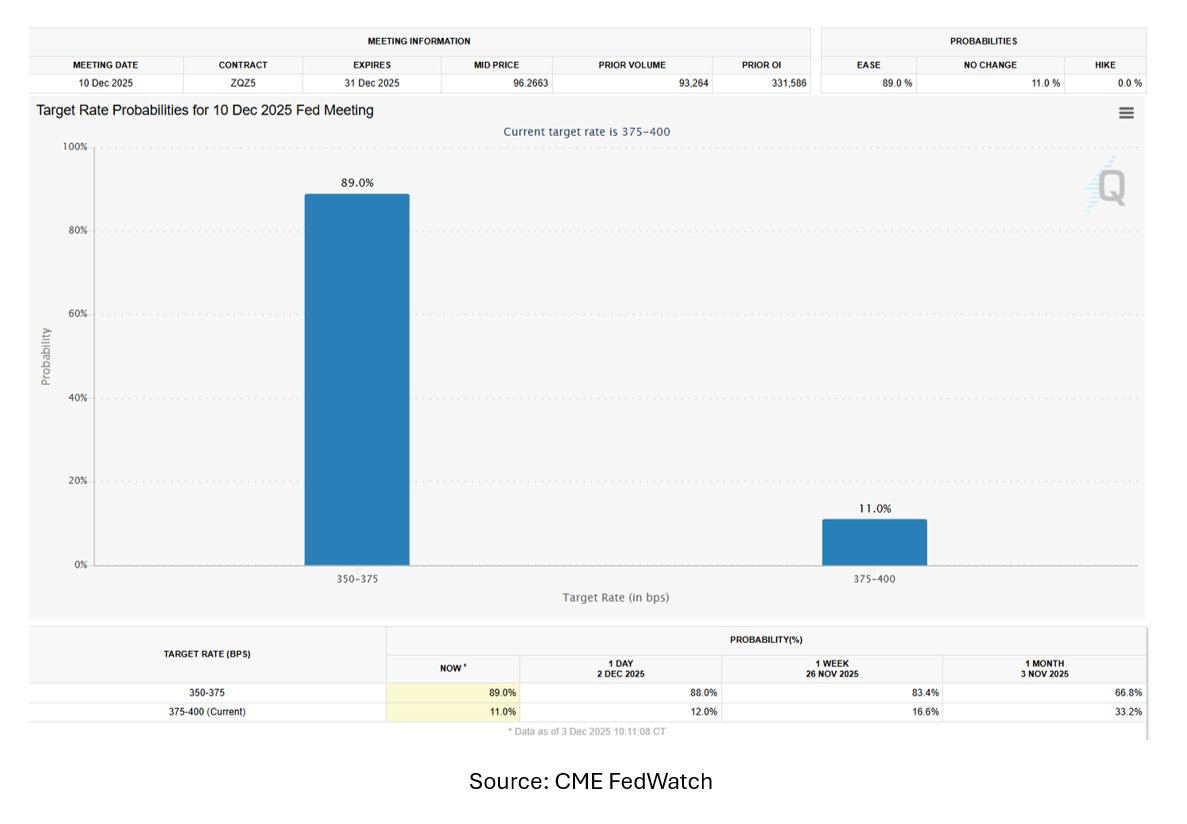
As of this morning (12/3/2025), the market is currently pricing in an 89% probability of a December rate cut. This is up significantly from recent weeks where the probability had gotten down to about 50%.
The pullback was driven largely by Chair Powell’s post-November press conference comments, where he emphasized that there was “spirited debate” among FOMC members and that a December cut was not guaranteed. Those remarks introduced doubt around what had been a widely expected year-end easing move.
The rebound in that expectation was mostly driven by several FOMC participants speaking publicly on the matter last week, and stating that a cut in December was their base expectation, which they caveated would need to be confirmed by the data leading up to their December 10th decision.
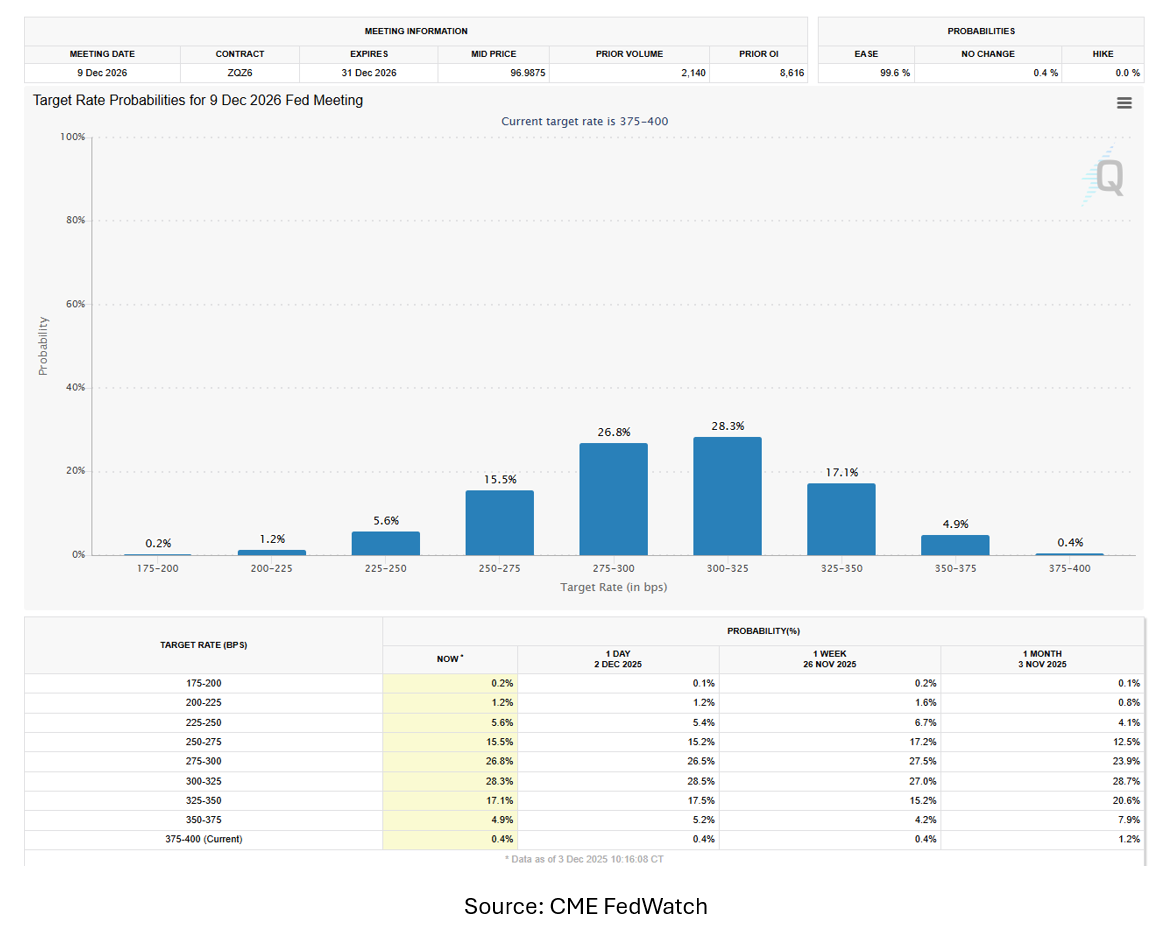
Beyond December, the market is still sorting out how far the Fed will go next year. Current pricing shows the largest probability (28.3%) placed on two cuts for next year (if there is a cut in December).
Markets are also giving meaningful weight to three cuts (26.8%), with a smaller—but not trivial—camp expecting only one cut (17.1%).
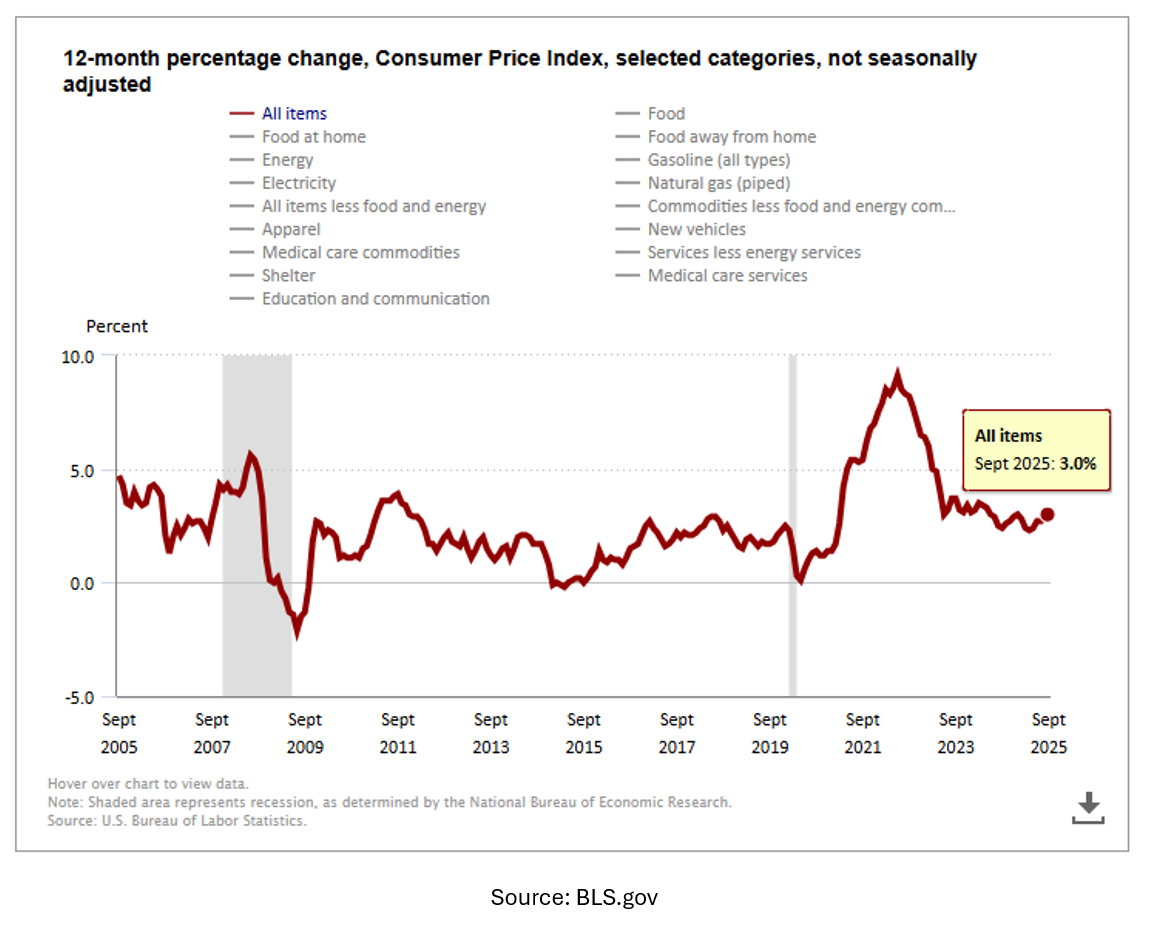
The Fed is operating in a tricky window. The government shutdown has caused a lack in significant data releases, including CPI and PPI, which are the primary reports used to measure inflation. As of now, the latest CPI data is from September, which reported an increase in inflation to 3.0% year-over-year.
Just as importantly, CPI has been drifting higher since bottoming in the low-2% range earlier this year. That makes this an unusual moment to be cutting rates while inflation appears to be re-accelerating—one reason policymakers have been more cautious lately and why markets have repriced expectations from a faster 2026 cutting cycle to a slower one.
At the same time, the Fed has been watching signs of labor market softening. But the shutdown-driven data gap makes it harder to confirm how quickly conditions are changing, which reinforces their “cut if data allows, pause if needed” posture.
A continued decline in short-term rates should help thaw parts of the CRE capital markets. Lower floating-rate costs directly benefit bridge and construction borrowers, and even 75–100 bps of cuts over the next 12 months would be a meaningful reduction in carry and development economics.
That said, the long-term fixed-rate market remains the bigger driver of values and transaction velocity. The 10-year Treasury has been notably stable in the 4.00%–4.10% range since the last Fed meeting—even while December cut expectations bounced around. After peaking near 4.80% in January, the 10-year has trended lower through 2025, bringing borrowing costs down and supporting early-stage value recovery via cap-rate compression.
Today’s 10-year level already reflects the likelihood of a December cut. The next move in long rates will depend more on how the Fed frames the 2026 path than on the cut itself. If guidance reinforces a gradual easing cycle and inflation doesn’t surprise to the upside, longer-term yields have room to drift into the high-3% range. Our base case remains a high-3% lower bound and low-4% upper bound for the 10-year in 2026—an environment that should support stable borrowing costs and continued, incremental value recovery for CRE investors.
Partner with us to navigate the complexities of commercial real estate. Get in touch today to explore how our expertise can unlock the full potential of your real estate investments.